
LogSpot v2 is here, and it is a big step forward.
When we first introduced LogSpot v1, the goal was simple: give Enhance server users something they never really had. Reliable per-site access logs. Since Enhance rotates and discards logs every few minutes, v1 stepped in by capturing traffic into a single file per site and unlocking GoAccess analytics. It worked, and many of you relied on it.
But we knew it could be better. Much better.
Today, we are rolling out LogSpot v2 for cPFence, and this release is not just an upgrade. It is a complete rethink of how traffic logging and analysis should work on Enhance servers.
What’s new in LogSpot v2?
- 80 percent lower CPU and disk I/O usage
- Per day log files with 30 days retention
- Built in log viewer with fast filtering by date, IP, status, user agent, or any text
- Live log tailing for real time troubleshooting
- CSV export of filtered results and downloadable raw log files
- GoAccess analytics with per day and all time statistics
- Full LogSpot automation from the cPFence WebUI
Lighter, faster, and dramatically more efficient
The most important change in LogSpot v2 happens behind the scenes. This version is significantly lighter on system resources. Through smarter buffering, I/O optimization, and tighter process control, we reduced CPU and disk overhead by around 80 percent compared to v1. On busy servers, the difference is immediately noticeable. Lower load, less I/O pressure, and smoother overall performance, even under heavy traffic.
Daily logs with real retention
LogSpot v2 now stores logs per day instead of a single rolling file. Each site keeps up to 30 daily log files, giving you a full month of history by default. This makes troubleshooting, audits, and traffic analysis far more practical.

Starting with LogSpot v2, the limit is per file. LogSpot keeps up to 30 daily files per site, with a default size of 10 MB each for new installations only, around 300 MB total, before truncation. You stay in control of disk usage without sacrificing visibility.
A real log viewer, right after login
Once you log in, you are greeted with the new LogSpot log viewer dashboard. This is no longer just a backend feature feeding GoAccess. It is a full traffic inspection interface built for day to day work.

You can browse requests in a clean table view, see timestamps, IPs, status codes, user agents, referrers, and request paths instantly, without waiting for heavy reports to load.
Powerful filtering and search
LogSpot v2 lets you analyze logs the way you actually need to. You can filter entries by date, IP address, HTTP status, user agent, request path, or any custom text. Whether you are hunting a bot, tracing a suspicious request, or reviewing a specific incident, the data is right there and fast.
Live log tailing for real time debugging
Sometimes you do not want history. You want to see what is happening right now. LogSpot v2 adds live log tailing so you can watch requests as they hit your site. This is perfect for debugging, testing rules, or validating changes in real time.
Export and raw access when you need it
Filtered results can be exported directly to CSV, making it easy to share data or run offline analysis. You can also download raw log files at any time. No lock in, no hidden formats, just your data when you need it.
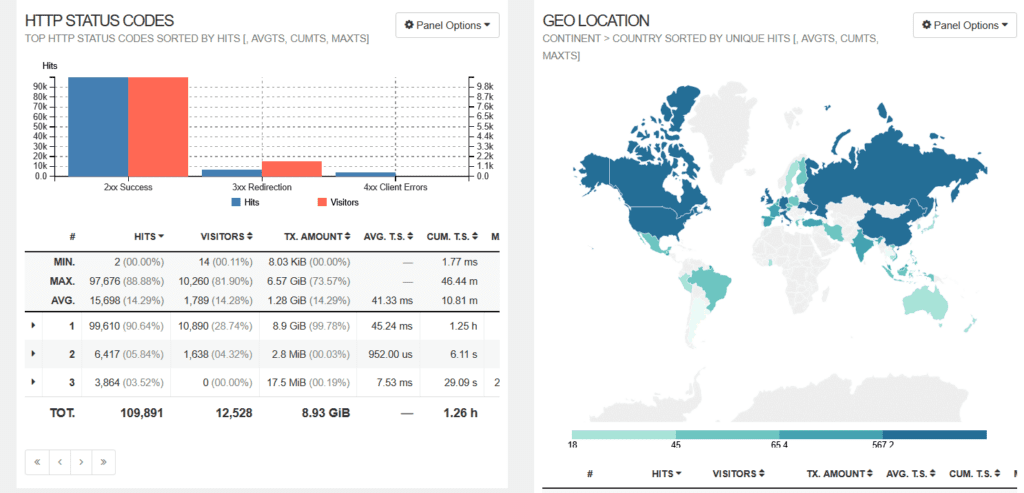
GoAccess, now more flexible
GoAccess analytics are still part of LogSpot, but now with more control. You can view statistics for a single day or across all available logs. This gives you both precise snapshots and big picture trends without switching tools.
Stunning Real-Time Analytics
LogSpot harnesses the power of GoAccess to provide:
- Instant visitor insights, including countries, IPs, and referrers
- Detailed OS and browser statistics
- Real-time visitor tracking and unique visitor counts
- Beautiful modern UI with Dark Mode included!
Same protection, better session control
Like v1, LogSpot v2 is protected behind the same secure login system. The difference is that sessions are now cleaner and more user friendly, with the ability to log out properly when you are done.
Full automation from the WebUI
One of the biggest quality of life improvements in v2 is automation. You can now manage LogSpot entirely from the cPFence WebUI. Enable or disable the module, adjust log size limits, restart the service, toggle auto login, or clear LogSpot data across all servers in your cluster with a single click. Managing logging at scale finally feels effortless.

All reports are instantly accessible at:
https://domain.com/traffic-reports/
Effortless Setup & Secure Access
Getting started couldn’t be simpler—activate LogSpot on your Enhance server with just one command:
cpfence --enable-logspot
How to activate Auto Login:
cpfence --enable-logspot-autologinA secure password is automatically generated per user (easily customizable), keeping your traffic reports safe and private:
/var/www/uuid/cpf_logs/yourpassword.txt
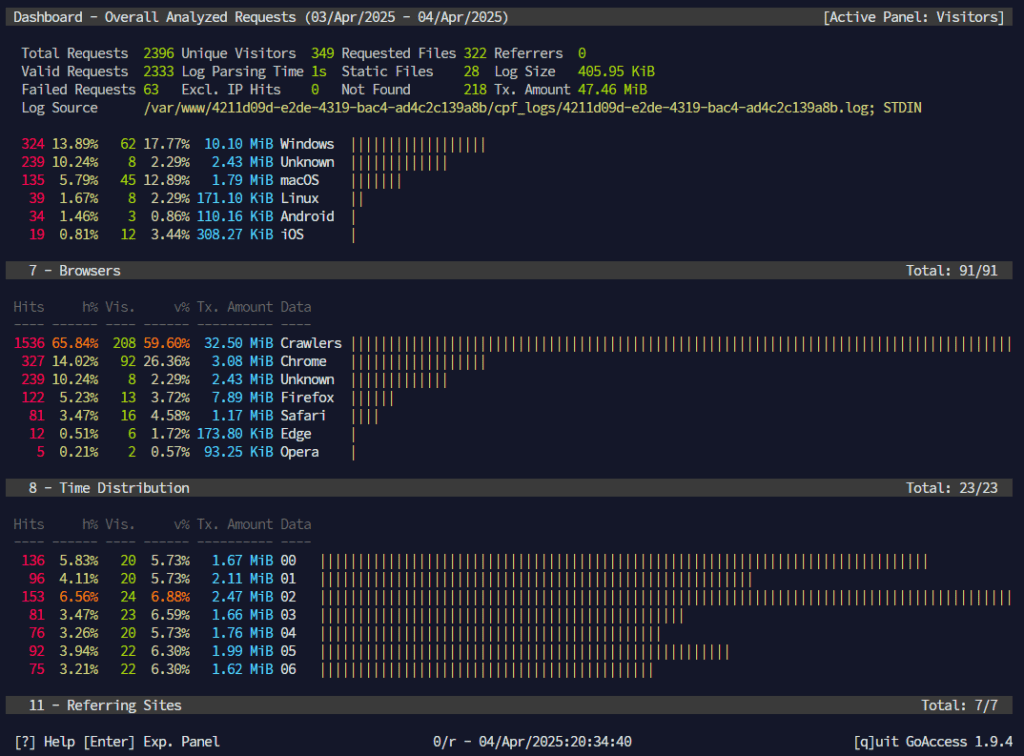
Bonus CLI Viewer for Admins
Admins, we didn’t forget you! Enjoy our incredible terminal-based log viewer:
cpfence --logspot-logs-viewer
Monitor and search website traffic live, right from your terminal.
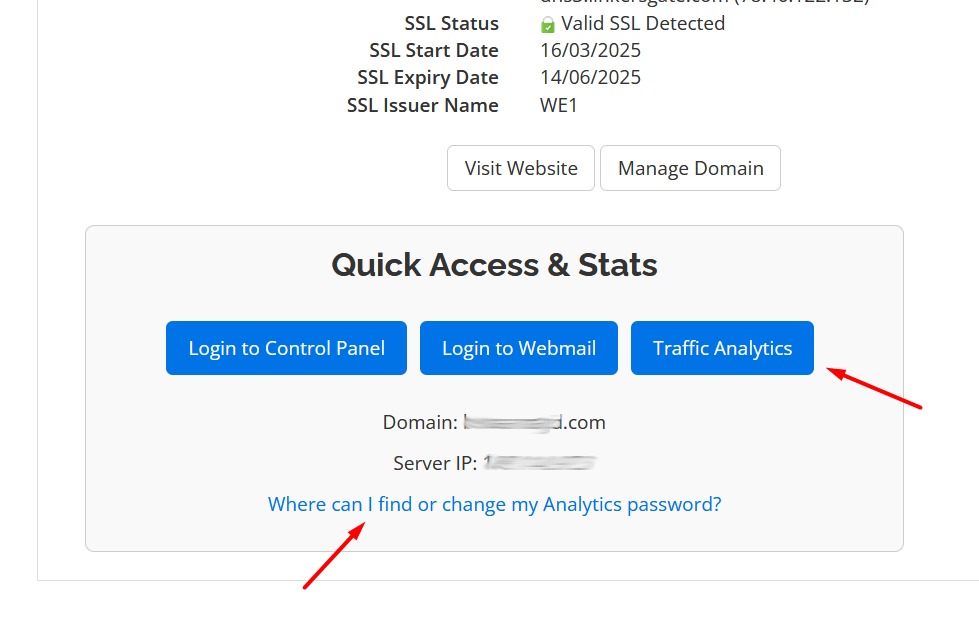
Seamless Auto Login WHMCS Integration
We’ve enhanced our WHMCS integration, making it easier than ever for clients to access their traffic analytics:
Update your WHMCS Enhance module at:
/whmcspath/modules/servers/enhance/enhance.php
Replace the existing enhance_ClientArea function with our improved version from this gist:
https://gist.github.com/cPFence/41c32ca43ecd1423ae9ff6d12437af8a (Auto Login )
https://gist.github.com/cPFence/06b053c79bad40729f2d7d2609b6f1c9 ( No Auto Login )
Your clients will instantly see a sleek Traffic Analytics button in their WHMCS dashboard:
Note for users running our daily updates and log maintenance script:
If you’re using the script from this guide, please make sure to update it to exclude `cpf_logs` directories from log rotation. These logs are managed automatically by the LogSpot module, and external truncation could interfere with analytics accuracy.
You can exclude them by adjusting the `find` command like this:
/usr/bin/find /var/www \

-path "*/cpf_logs/*" -prune -o \

\( -name "*.log" -o -name "*_log" \) -size +5M -type f -exec sh -c '

for file; do

owner=$(stat -c "%u:%g" "$file")          # save UID:GID

tail -c 5M "$file" | /usr/bin/sponge "$file"

chown "$owner" "$file"                    # restore ownership

done

' sh {} +
The script on our GitHub Gist has been updated to reflect this change. Make sure to grab the latest version if you’re using LogSpot.
LogSpot v2 is built for real servers
This release is about practicality. Less overhead, more visibility, better control, and tools that actually match how server admins work on Enhance environments. If you relied on v1, v2 will feel familiar but far more powerful. If you never used LogSpot before, this is the version to start with.
If you are not using cPFence yet, now is a great time to try it. Start your free trial now! and see LogSpot v2 and the rest of cPFence in action.


Team,
THANK YOU THANK YOU THANK YOU…
I do see a LOT of progress on this, and even if only conceptually, I hope my contribution on git helped move your product along.
This is a HUGE plus for our team!
– Matthew Sine
8Dweb
You’re welcome Matthew, we’re glad you found this update useful. And yes, your ideas helped us build the best log viewer and analysis tool.
cPFence Team
Fantastic, I have updated the readme on git to direct link to this announcement, since I believe using your product is now the BEST method for log retention/viewing. Finally a functional web log system for Enhance. Thanks again!