Owl v4™: Unified Cluster Monitoring with 30-Day Performance History

The Owl just leveled up.
We’re thrilled to roll out Owl v4, bringing full cluster-wide server monitoring with historical performance data up to 30 days back.
If you’ve been with us since Owl v3, you already know the drill: Smart 24/7 process monitoring, automated service recovery, and instant malware blocking, all handled quietly in the background while you sleep.
Owl’s always been the watchdog you can count on, keeping tabs on your key services:
SSH • CRON • Rspamd • Postfix • Dovecot • Pure-FTP • MySQL • Web Servers (Apache, LiteSpeed, OLS, Nginx) • DNS • Control Panel • AppCD
If something drops, Owl jumps. You get an alert, and the failed service restarts before you’ve even opened your terminal.
It also keeps an eye on CPU, RAM, Disk, Inodes, and I/O usage, firing alerts at the first sign of abuse. With the built-in MySQL Governor, it even spots and tames resource hogs to keep databases smooth and fast.
Now, Owl v4 takes that same sharp vision and gives it wings.
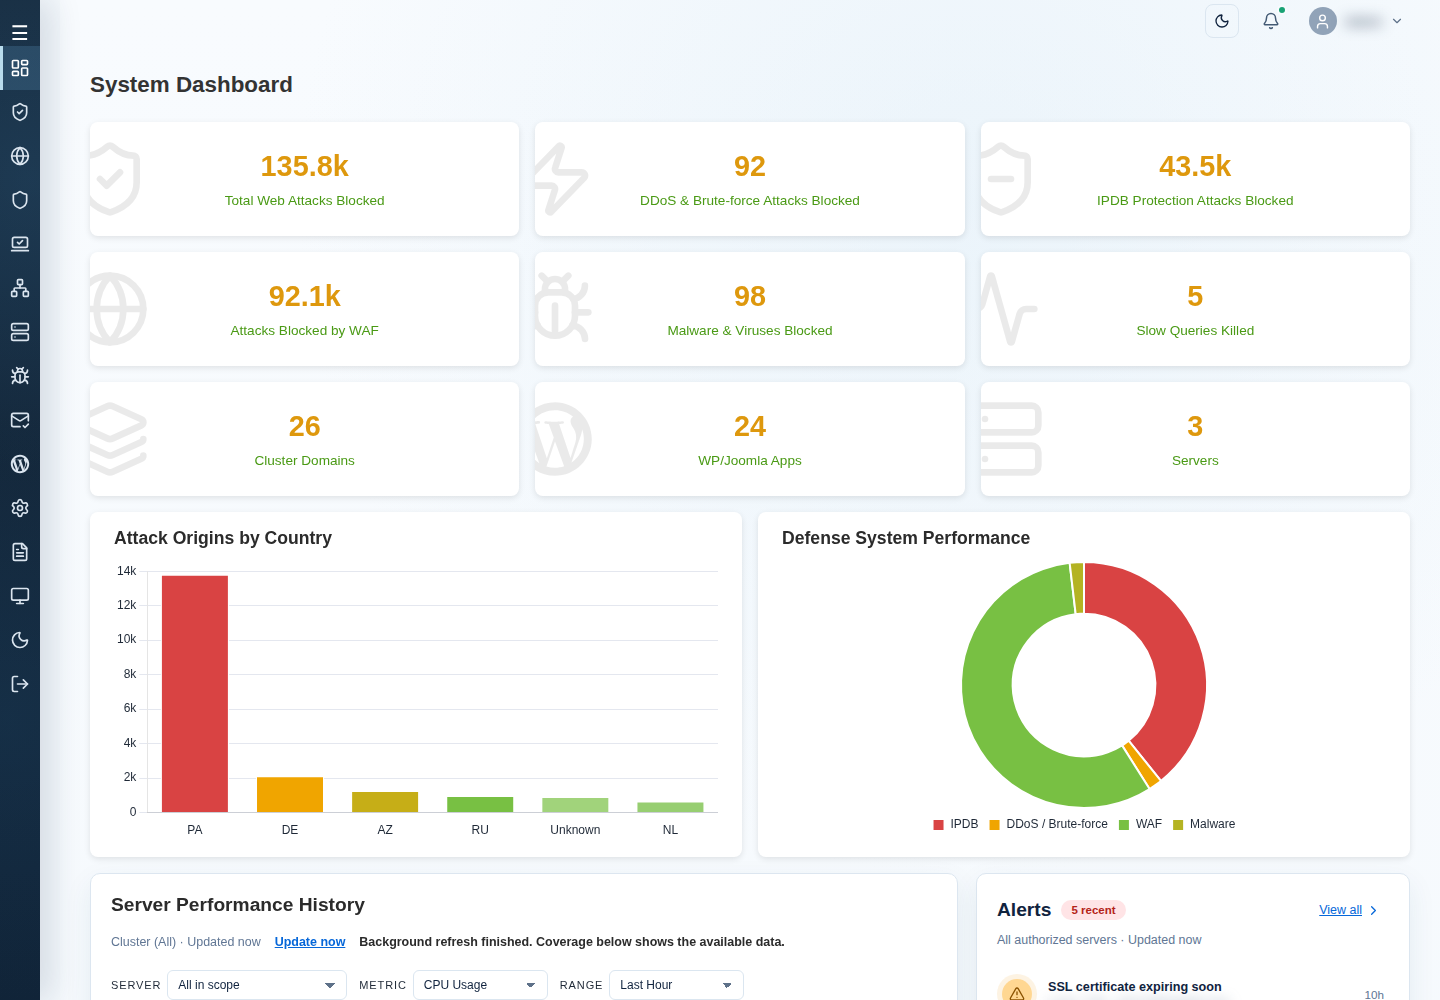
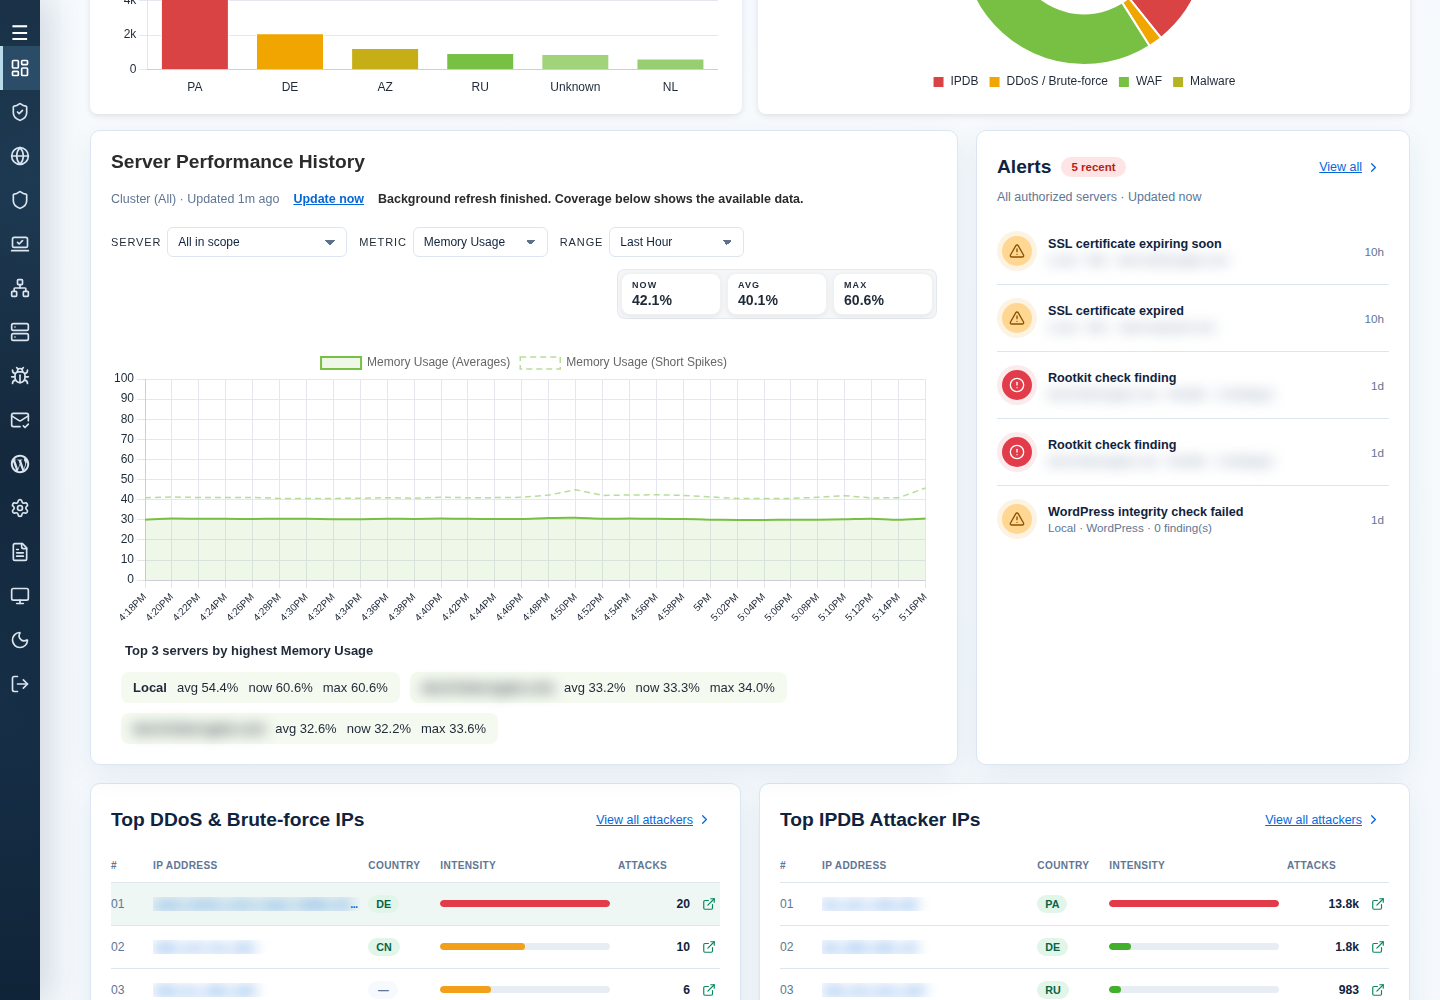
In cPFence v4+, open System Dashboard and choose your dashboard server scope. Scroll to Server Performance History, then use SERVER, METRIC and RANGE to focus the chart. The chart’s server choice changes the displayed data, not your bulk-action targets.
You can now:
- View real-time and historical metrics across your entire cluster or individual servers
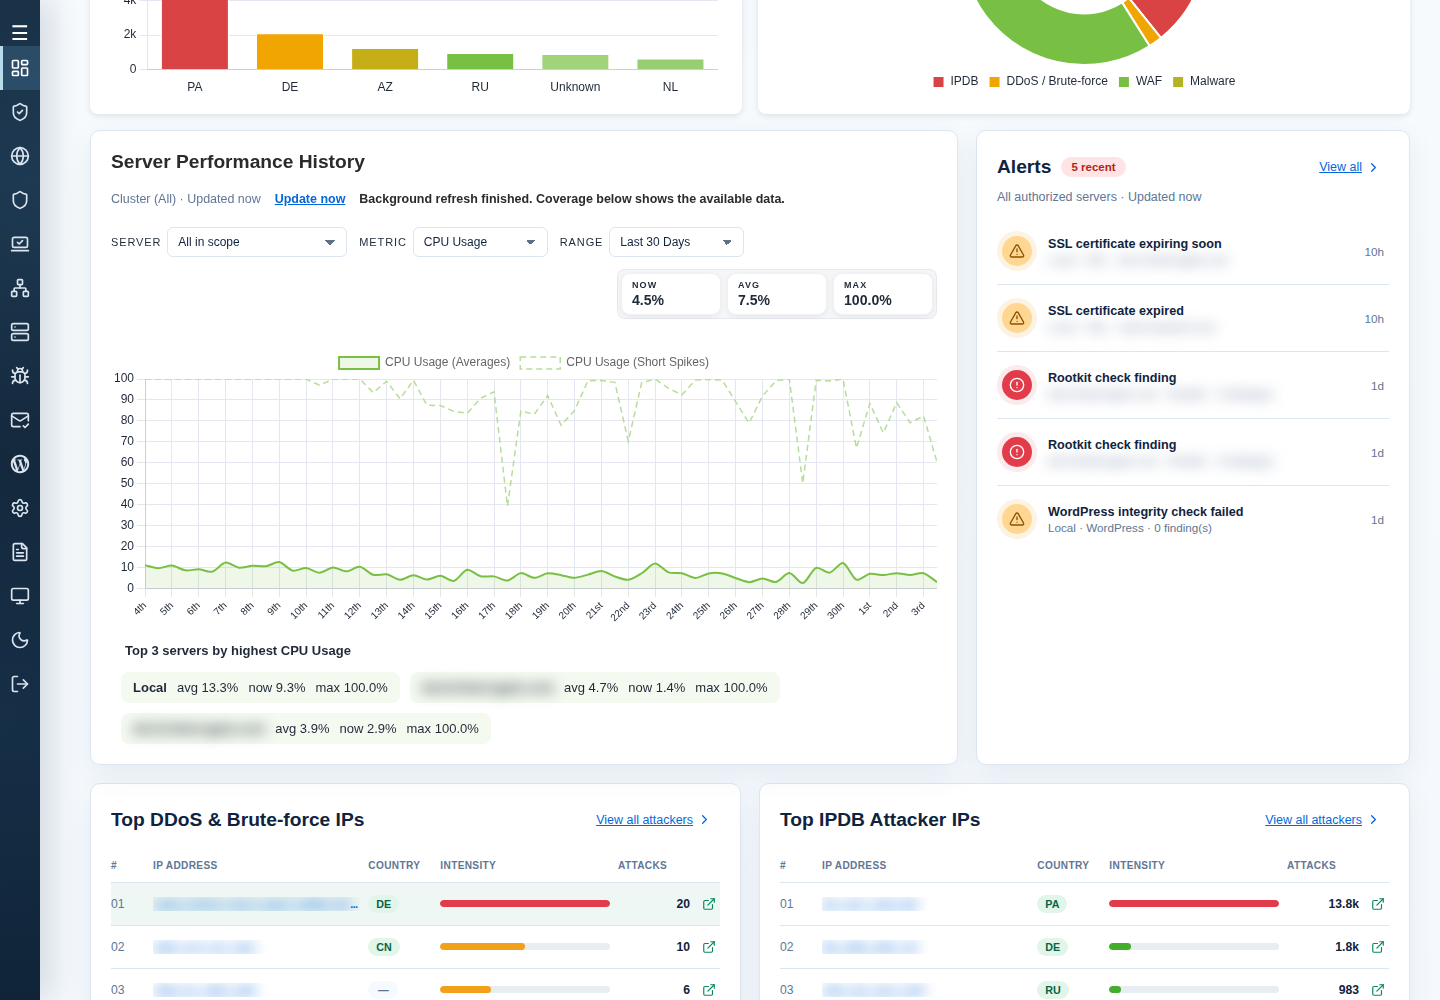
- Switch between metrics (CPU, memory, disk, IO, traffic, and more) right from the dashboard
- Explore performance trends from the last hour to the last 30 days
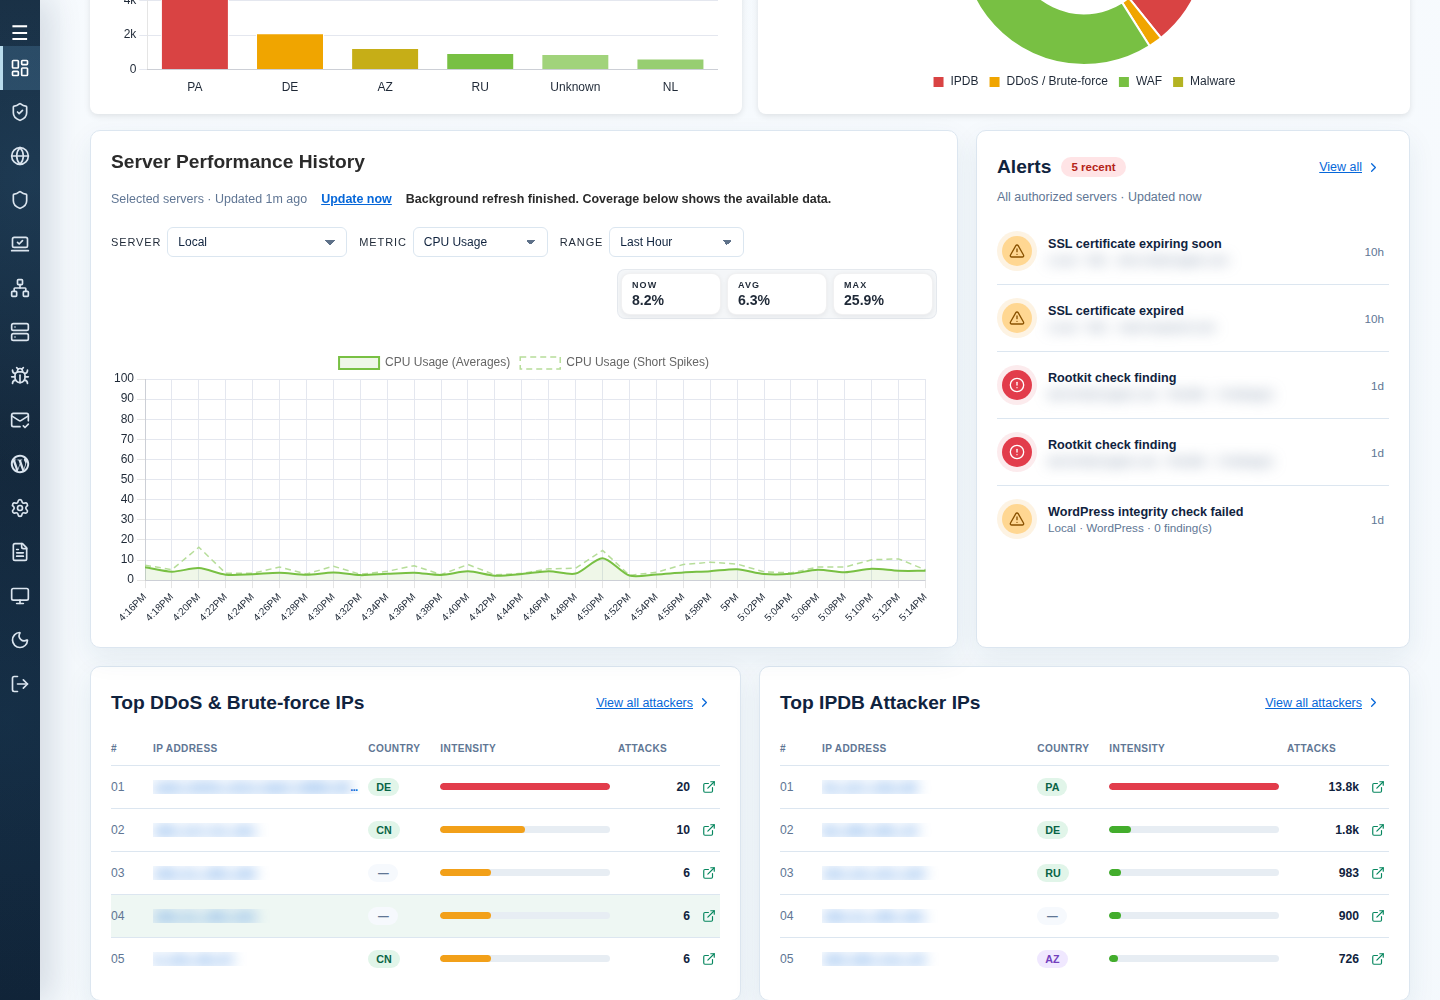
- See top resource nodes and compare usage across servers
- New CLI/WebUI tools to display cPFence Owl™ statistics summaries with custom time ranges
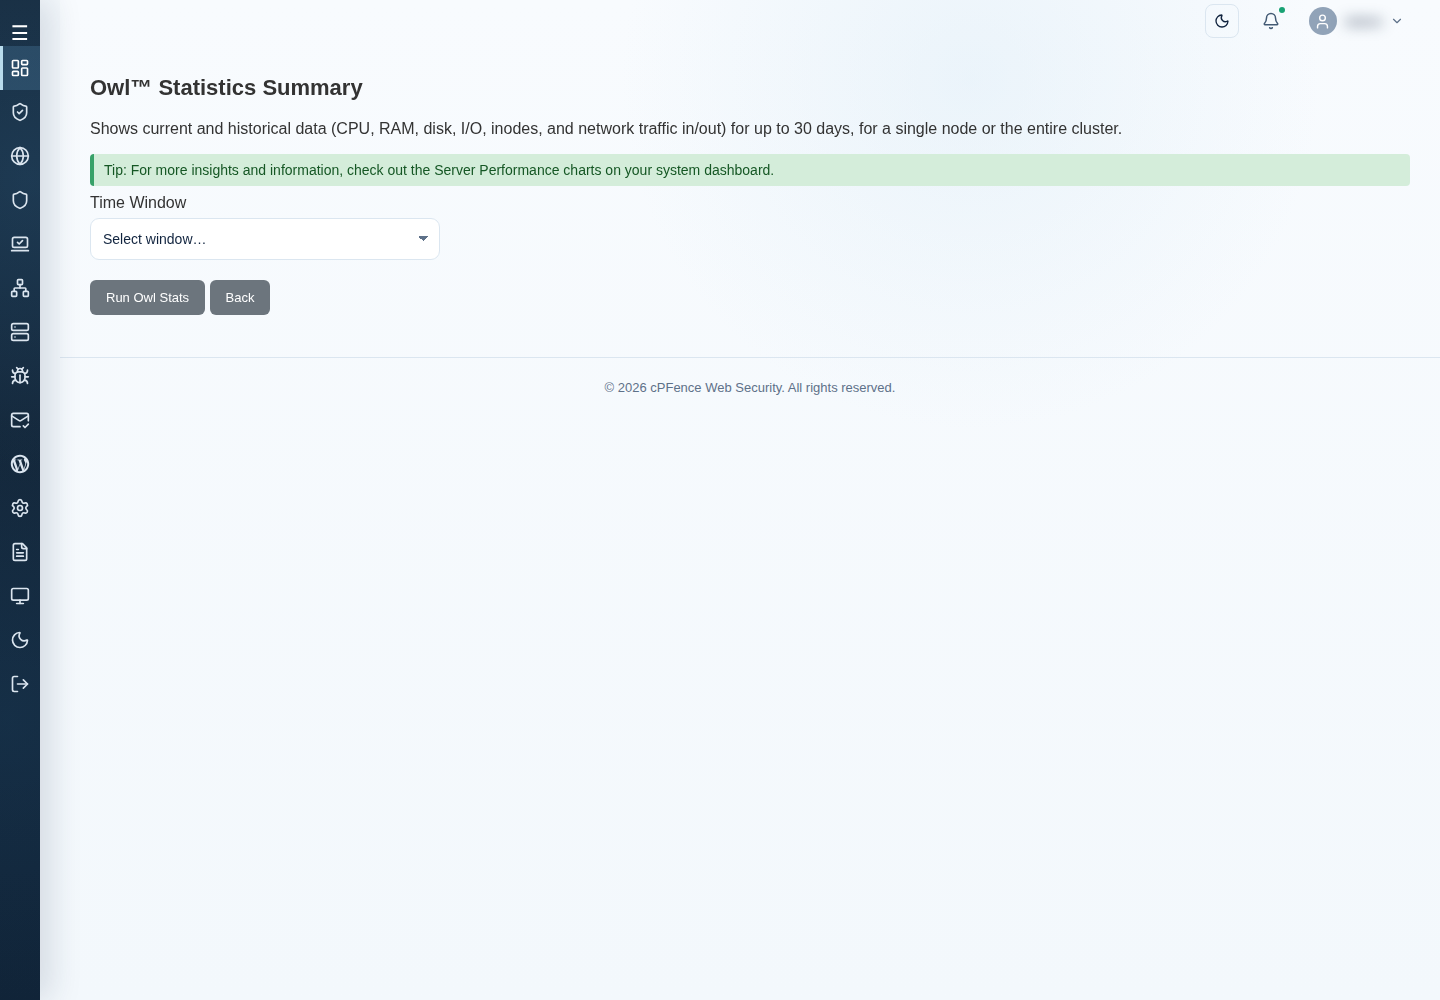
For a quick summary from the WebUI, open Advanced Tools → Owl™ Statistics Summary, review the server targets, choose Time Window, then use Run Owl Stats. Read the final output. The chart and summary can cover different scopes, so check both before comparing them.
You can run cpfence --owl-stats 2h → shows Owl™ statistics summary for the last 2 hours.
If no window is given, it defaults to 30 minutes. Supported formats include 15m, 2h, 1d, 7d, etc.
Get a quick, clear overview of server health and performance trends right from the terminal, no browser needed. Ideal for quick checks, automation scripts, or SSH sessions.
Want to keep collecting history or pause it? In System Settings → General Settings → Monitoring, review Owl monitoring and Owl history on the intended server. As root on that server, the CLI alternatives are:
cpfence --enable-owl-history
cpfence --disable-owl-history
Turning history off stops new collection; it does not erase the retained charts. Check the observation time—missing or old data is not a fresh health result. For thresholds, delivery channels and service-recovery controls, see Owl alerts and watchdog settings.
Need to see what Owl is doing? Use cpfence --monitor-owl-logs on the intended server; stop viewing with Ctrl+C without turning Owl off. cpfence --restart-owl restarts the module when you deliberately need that operation.
And all that without a single API query, lightweight, zero overhead, fully local. Every data point stays inside your servers, fully GDPR and CCPA compliant. Nothing leaves your infrastructure.
Available now in both WebUI and CLI, Owl v4 comes included with your cPFence subscription, no setup, no extra license, just more insight and less guessing.
Because when the Owl sees everything, you don’t have to.
For query-duration controls and exclusions, explore Owl AutoMySQL resource management.
Not using cPFence yet?
See how effortlessly it keeps your servers secure, optimized, and under control – all in one dashboard.
Start free trial