
Identify a problematic WAF rule
Use cPFence v4+ tracking when a legitimate request receives a WAF error. Instead of searching through unrelated logs, follow the affected domain and identify the rule behind the blocked request.
Track one domain
Section titled “Track one domain”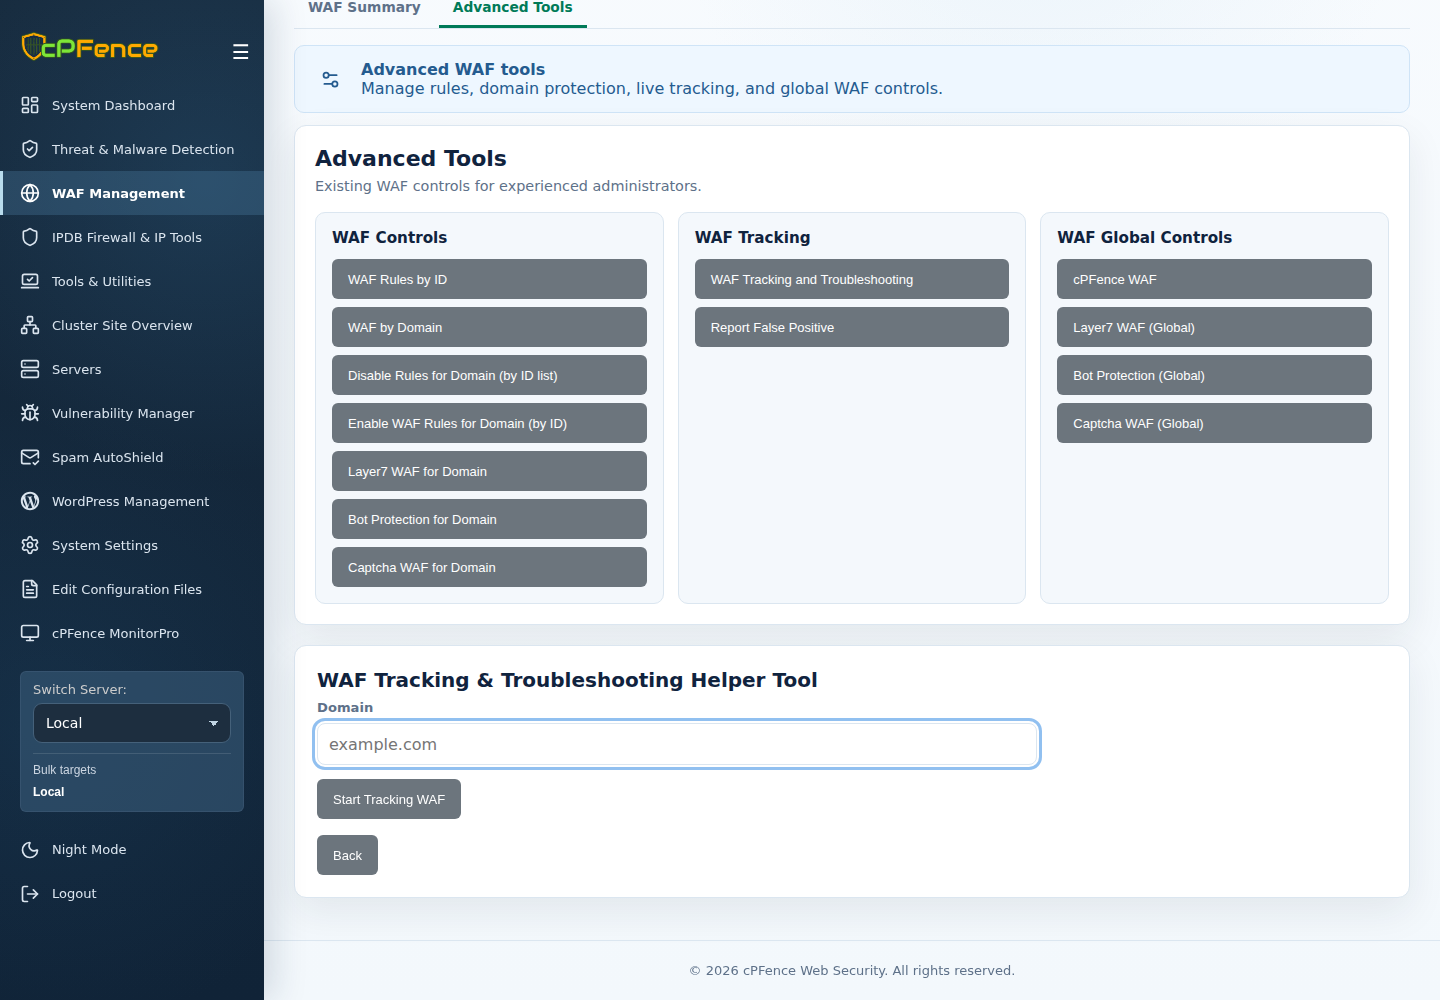
- Open WAF Management → Advanced Tools → WAF Tracking and Troubleshooting.
- Check the sidebar target, enter Domain, and click Start Tracking WAF.
- Repeat the affected request and note the rule ID, URL, server and time.
- Click Stop when finished. Stopping the viewer does not disable protection.
Support users need tracking permission. Keep the affected domain and sidebar target matched to the server handling the request.
Check the blocked request
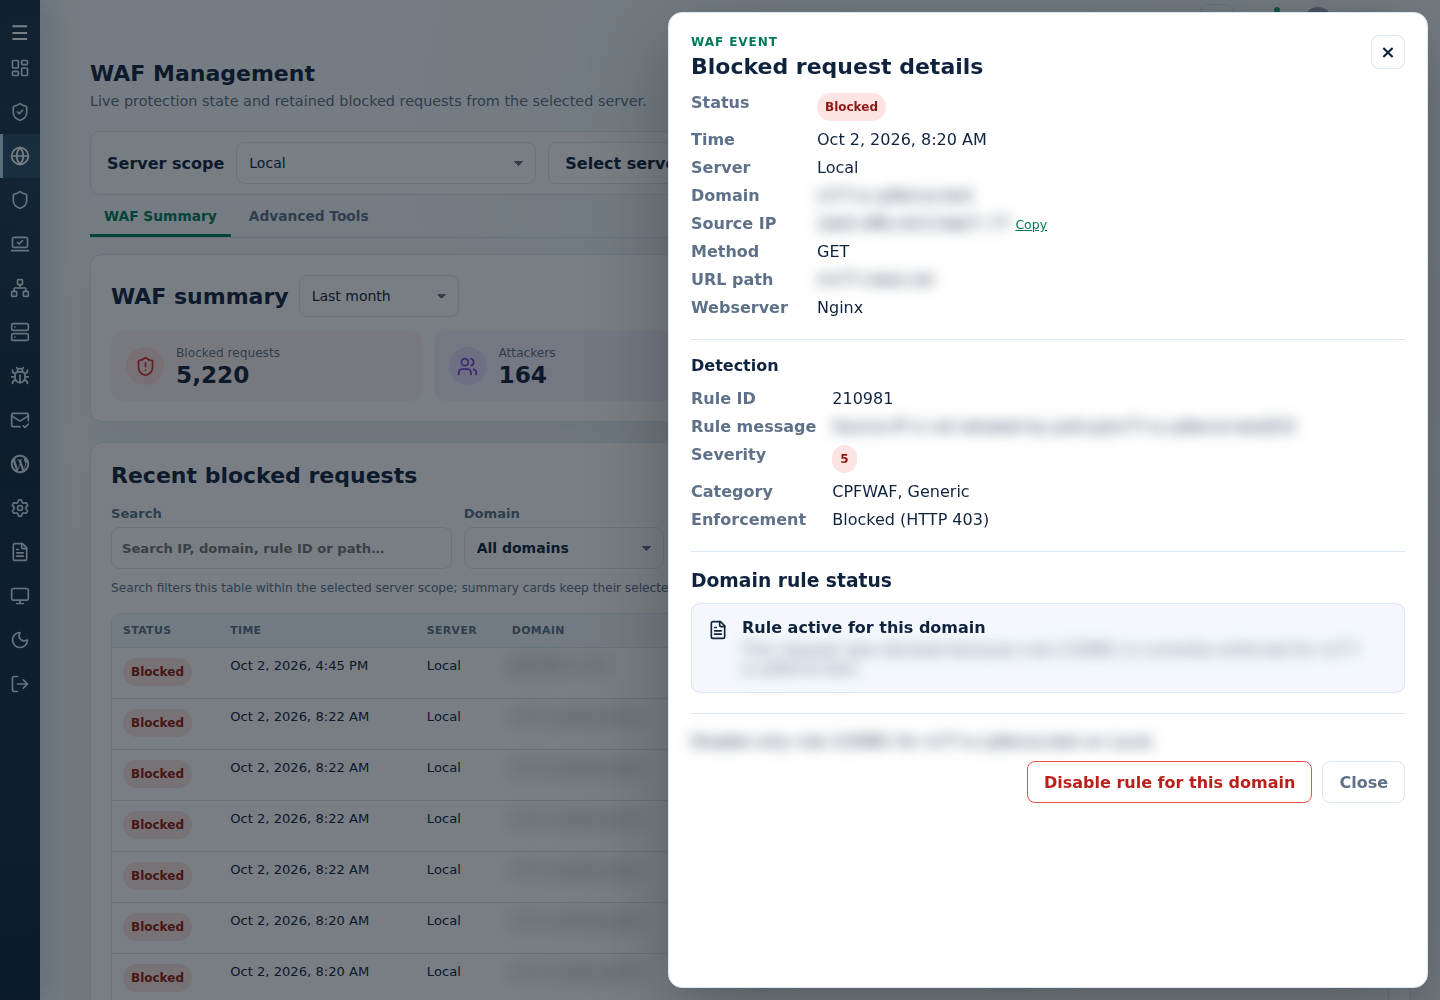
Section titled “Check the blocked request”You can also open WAF Management → WAF Summary, find the affected request in Recent blocked requests, and open its details. Match Time, Server, Domain and URL path to the problem, then note Rule ID, Rule message and Enforcement.
Track server-wide activity
Section titled “Track server-wide activity”For general troubleshooting across domains:
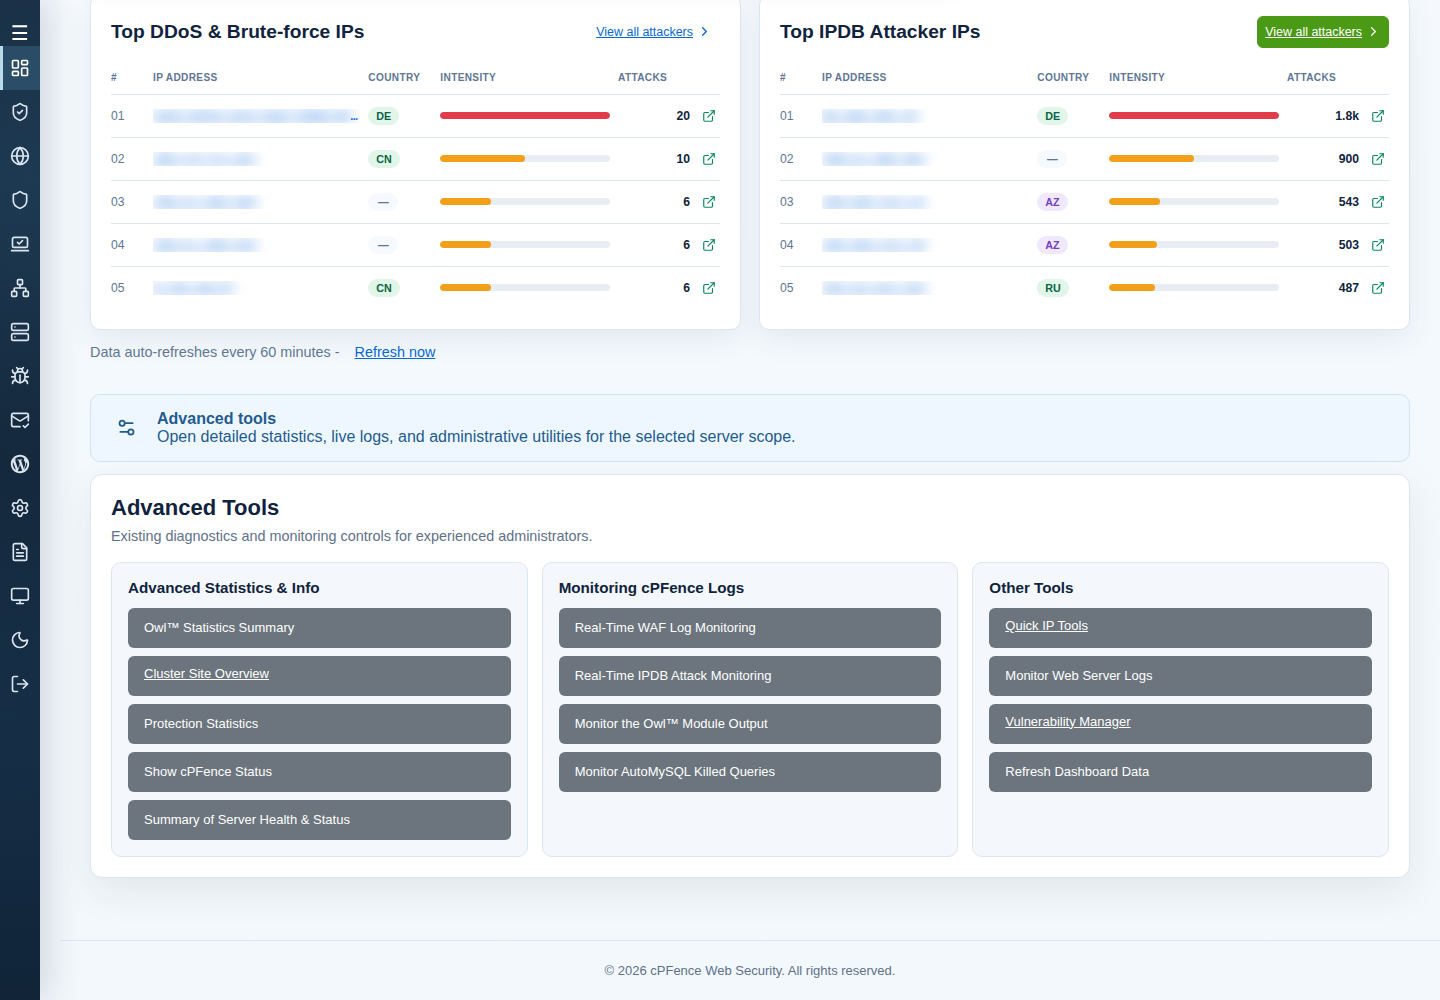
- Open System Dashboard and check the selected server scope.
- Find the monitoring tools and choose Real-Time WAF Log Monitoring.
- Follow the relevant entries, keeping their domain and time with the rule ID. Stop the viewer when finished.
Domain-level tracking is usually easier when only one site is affected.
Using the CLI
Section titled “Using the CLI”As root on the target server:
| Scope | Command |
|---|---|
| One domain | cpfence --debug-domain-waf |
| Whole server | cpfence --monitor-waf-logs |
The first command prompts for a domain; the second follows server-wide WAF activity. Repeat the failed request while tracking and use Ctrl+C to stop.
Example: finding the rule ID
Section titled “Example: finding the rule ID”For example, a log entry might report Access denied with code 403, XSS Attack Detected via libinjection, rule 941100, and affected URL /. Match all of these to the request you are investigating; a rule ID alone is not enough to call the block a false positive.
If that request is legitimate and needs a domain-specific exception, the corresponding command is:
cpfence --disable-waf-domain-byid example.com 941100Replace example.com and the rule ID with the affected domain and confirmed rule. This weakens that rule’s protection for the domain, so review WAF rule exceptions first. Test the affected request after the completed change and re-enable the rule when the exception is no longer needed:
cpfence --enable-waf-domain-byid example.com 941100The tracking tool may suggest an exception; it does not establish that a request is safe. Protected WAF features use their dedicated controls instead of generic rule-disable commands.
Use Report False Positive for review, omitting credentials and unrelated private data.