
Read the dashboard and choose server scope
Use System Dashboard to review health, alerts, attacker history, and coverage. Choose the intended server before acting.
For cPFence v4+ on Enhance. You need View dashboard page; commands, live monitoring and settings have separate grants. Remote work also needs a connected, licensed destination.
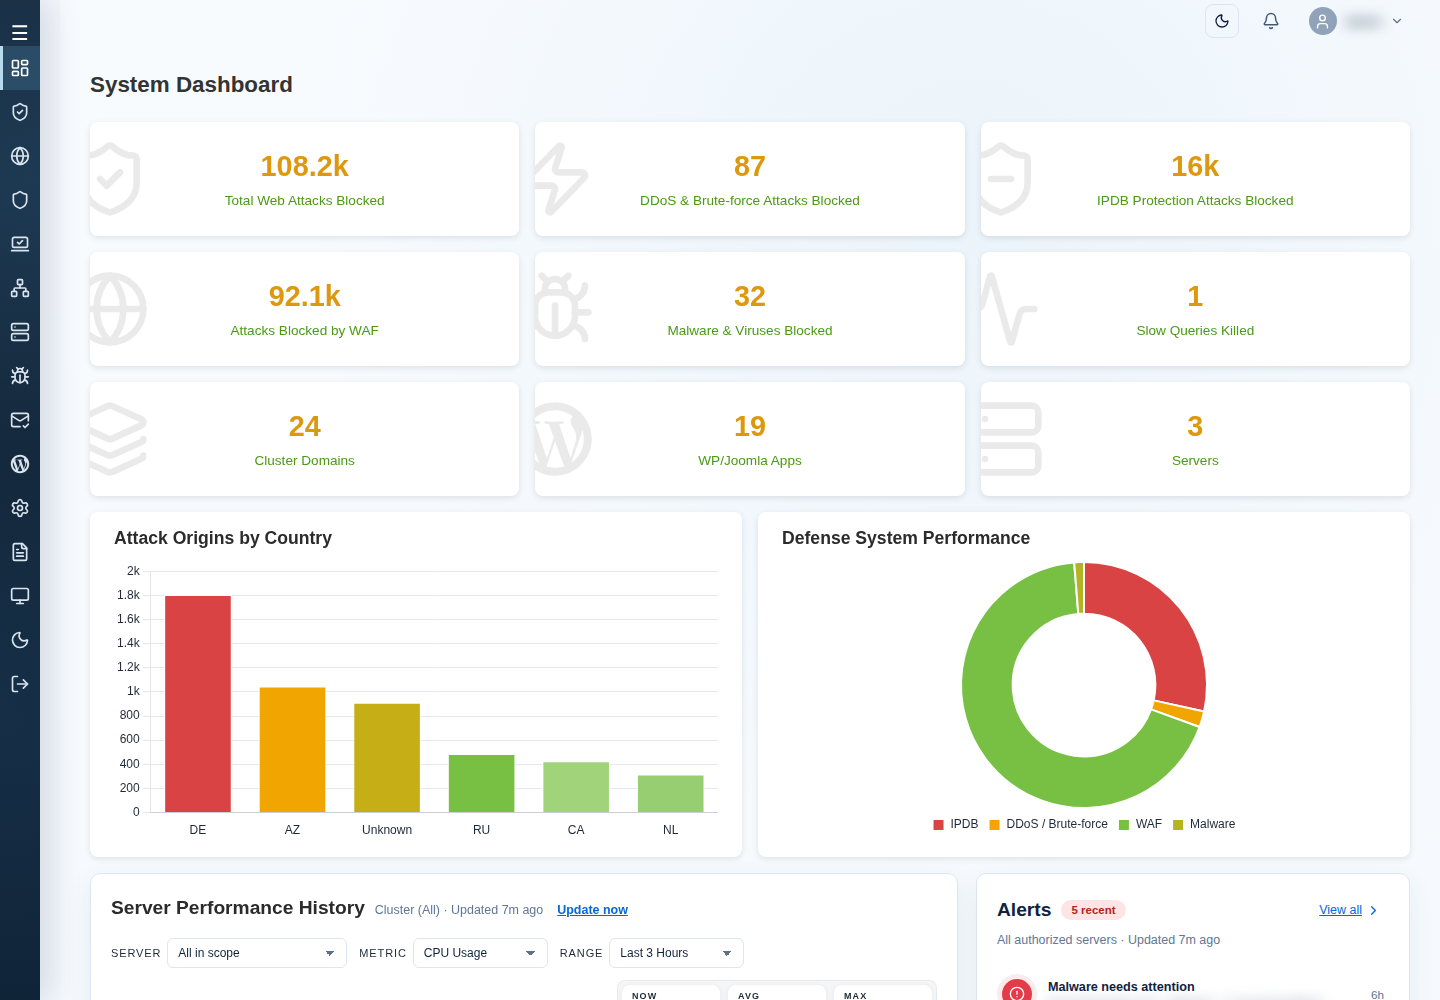
1. Choose which servers to include
Section titled “1. Choose which servers to include”- Open System Dashboard.
- Review the server selector in the sidebar and its selection summary. The dashboard starts with All Servers when there is no saved selection; an existing selection can carry over between pages.
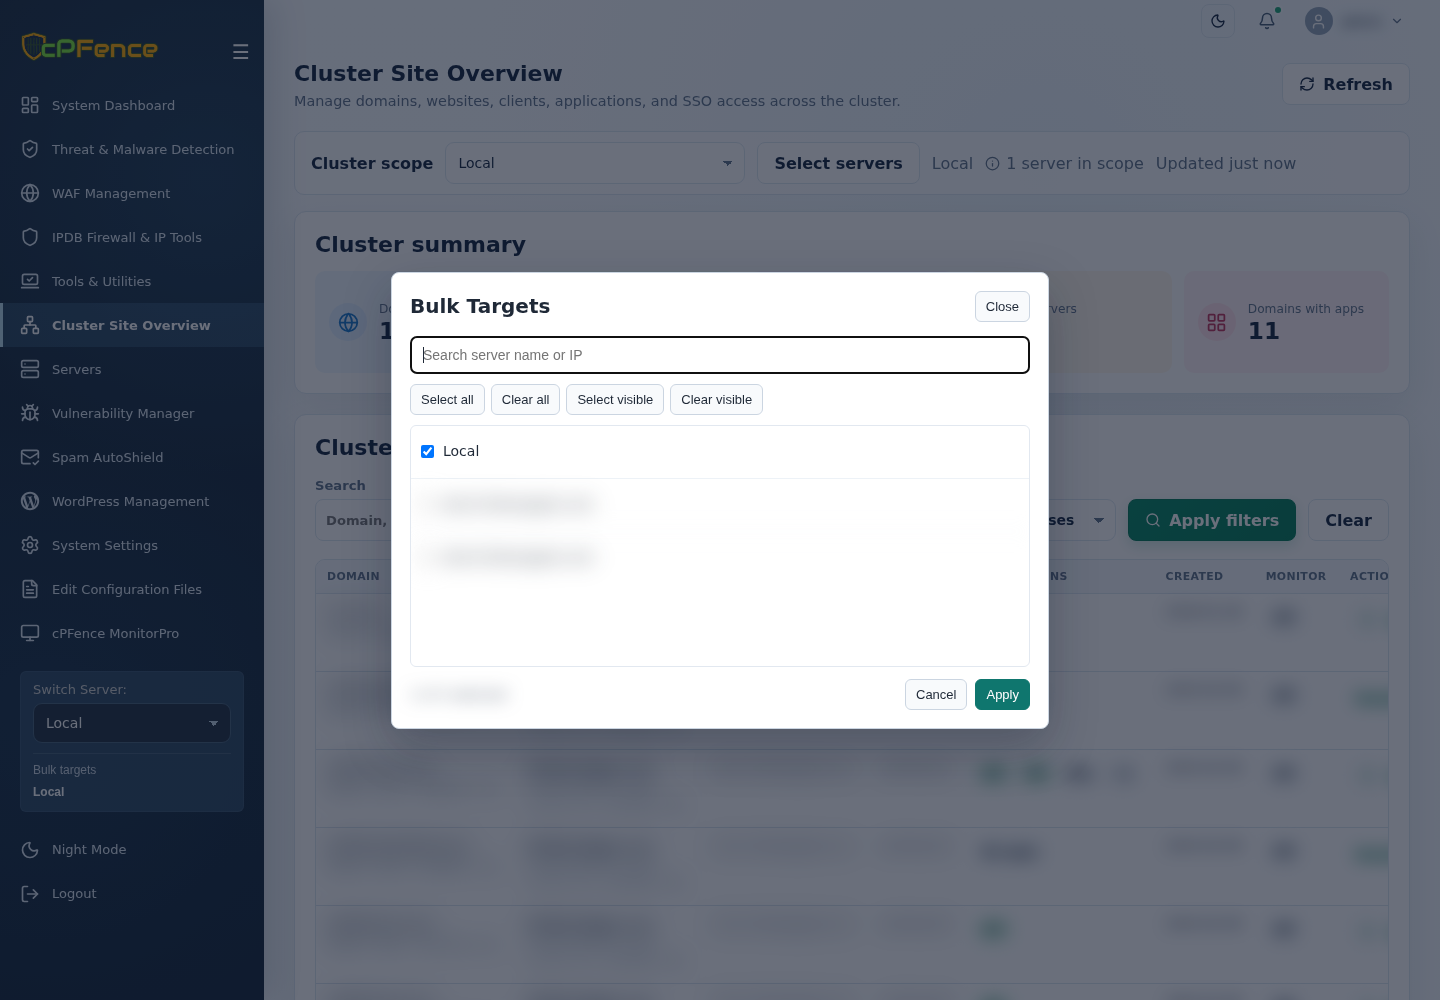
- Choose Local, a named secondary server, All Servers, or All Servers (No Local). For a subset, open Select servers → Bulk Targets, search with Search server name or IP, check the intended members, and select Apply.
- Check the coverage and freshness notices before interpreting totals.
| Scope or control | Meaning |
|---|---|
| Local | The Enhance main control panel server running this WebUI. |
| A named server | That permitted server, not every server with a matching name or address. |
| All Servers | The account’s authorized cluster scope, including Local. Coverage notices identify unavailable members. |
| All Servers (No Local) | Authorized secondary servers, excluding the main control panel server. |
| Select servers | An explicit subset. Search names or addresses in the picker, check the intended members, and review the selection count before applying. |
| All in scope | A table or chart filter that includes servers already inside the chosen scope. It does not add servers to that scope. |
Searchable selectors and pagination help with large clusters. Visible rows, filtered results, and selected servers are different sets; filtering alone does not select action targets.
In Bulk Targets, Select all/Clear all act on the full list, while Select visible/Clear visible act on search results. Review the count and hidden selections before Apply; Cancel keeps the previous scope.
System Settings, Edit Configuration Files, Threat & Malware Detection, Vulnerability Manager, Spam AutoShield, and MonitorPro load one server. A one-member subset is retained; otherwise an aggregate selection prefers Local when available. Check the page’s Server scope. Settings bulk apply chooses destinations separately.
2. Read health and security history
Section titled “2. Read health and security history”- Review the summary cards and any coverage notice. Inventory totals and successfully observed protection data answer different questions; an unavailable secondary server is not evidence that it is healthy.
- In Server Performance History, choose SERVER, METRIC, and RANGE. All in scope combines the included servers; a named server narrows this chart.
- Select Update now to update the chart view or Refresh now to refresh the dashboard. Check the displayed observation times instead of assuming every item is fresh because the page refreshed.
- Open Alerts → View all, or View all attackers under Top DDoS & Brute-force IPs or Top IPDB Attacker IPs. Use the drawer’s filters. Attacker IP links open the external AbuseIPDB reference; they do not open current firewall policy. Where Load more is offered, it appends another available history page.
Card links open quarantine, domains, and applications. Confirm a historical alert’s current finding on its owning page before acting. AbuseIPDB links open an external reputation reference.
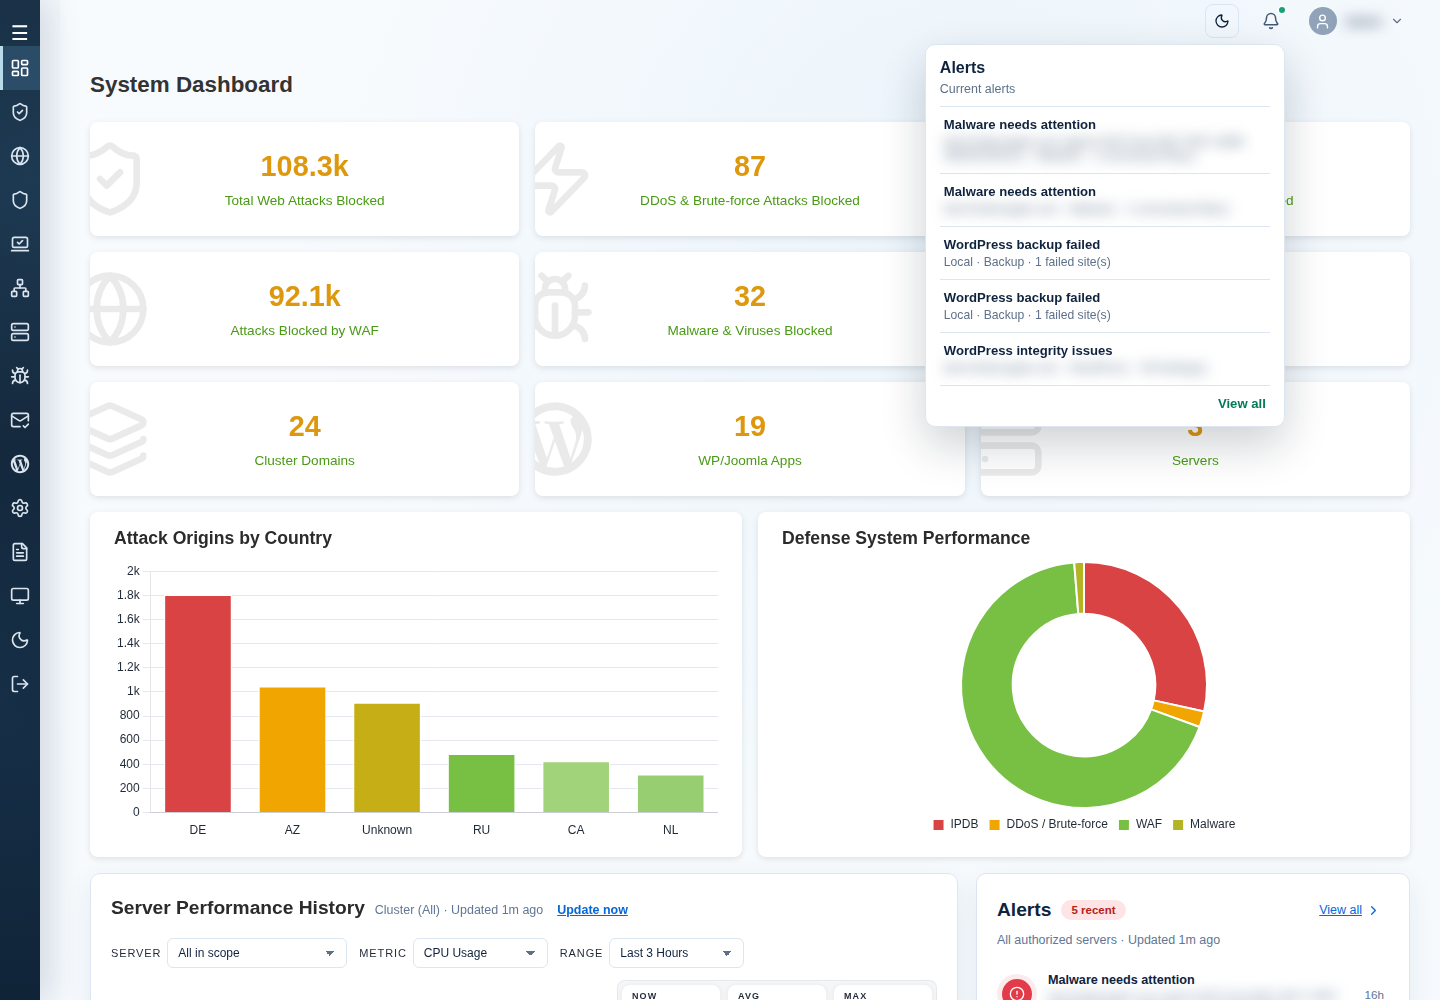
From another page, select the header’s Open current alerts control. Open an event to continue to its owning page, or choose View all for the dashboard history. Check the server scope and current finding before taking action.
| Chart summary | Meaning |
|---|---|
| NOW | The latest available observations, combined when viewing several servers. They can be older than the page refresh. |
| AVG | The average of available observations in the selected range. |
| MAX | The highest recorded value in that range. |
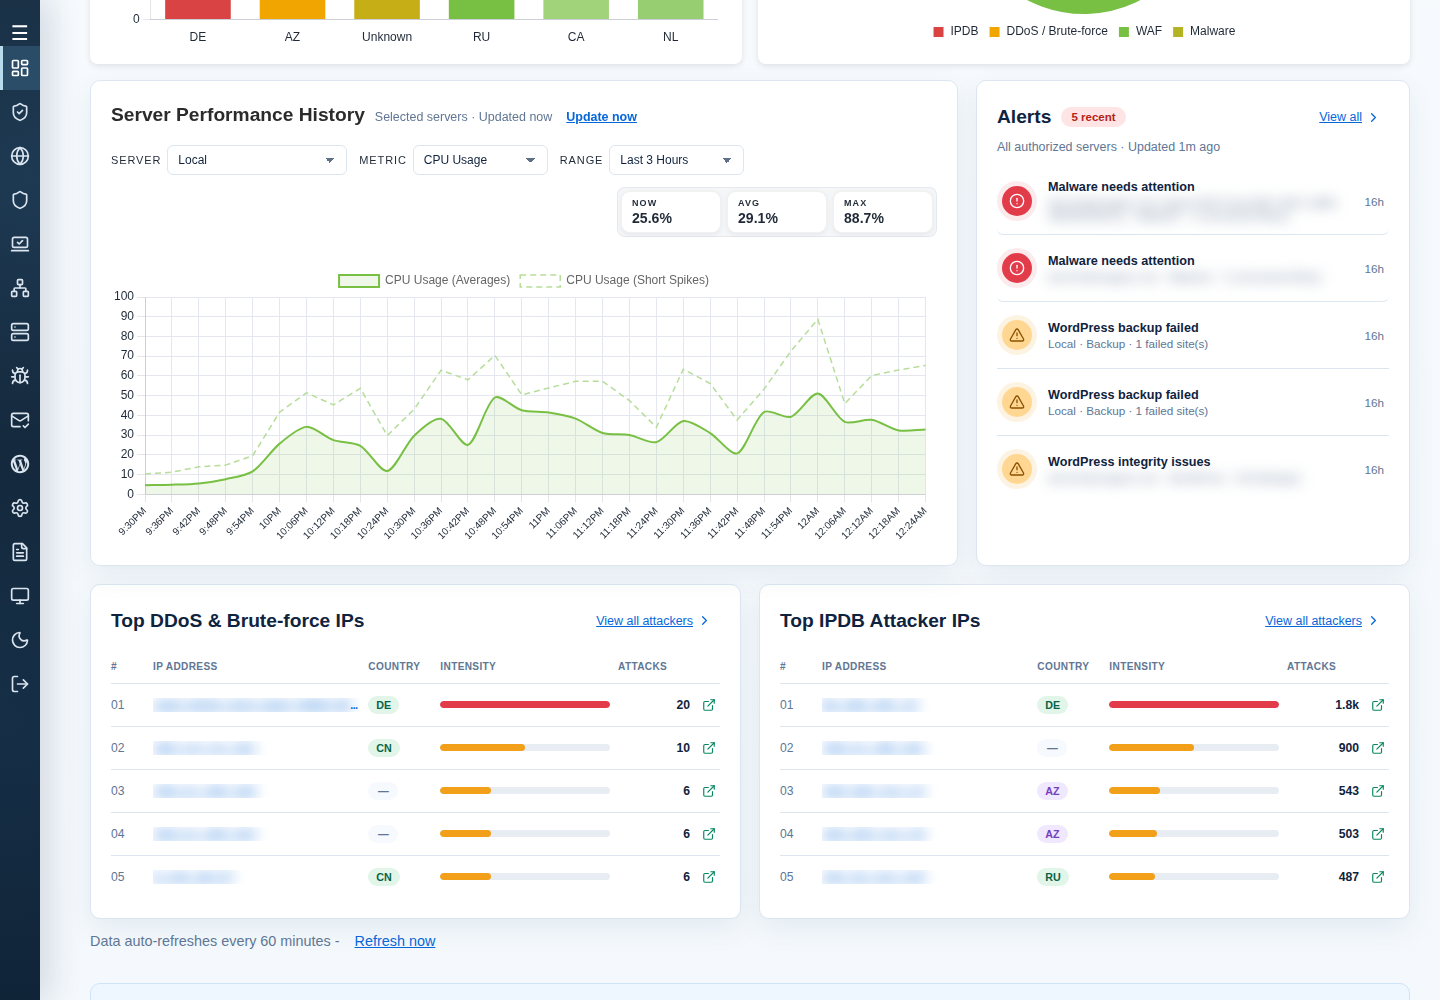
CPU, memory, disk, inode and I/O measurements use percentages; Load Average is a load value, not CPU percentage. Network summaries show inbound/outbound values in the displayed units. In an aggregate view, choose an individual server to investigate a spike; a cluster average can hide one busy member. Missing data is not zero usage.
Review DDoS and brute-force history
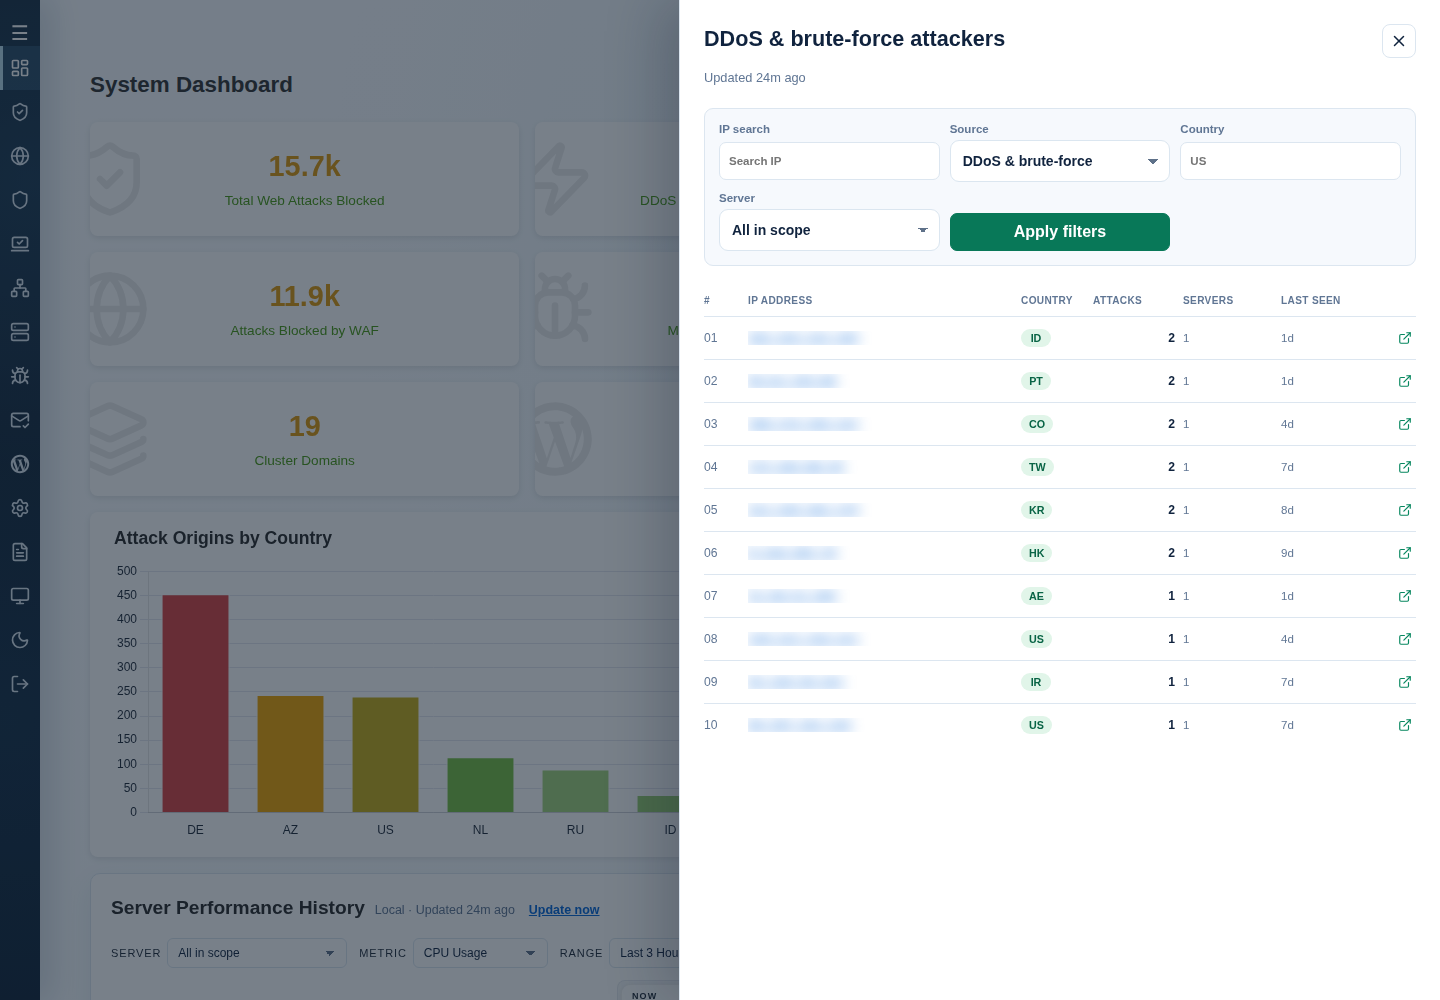
Section titled “Review DDoS and brute-force history”- Choose the dashboard’s server scope, then select DDoS & Brute-force Attacks Blocked.
- In DDoS & brute-force attackers, check Source is DDoS & brute-force. Enter an address in IP search (Search IP), optionally enter a country code in Country, and choose Server, then Apply filters.
- Compare the IP address, country, displayed ATTACKS, SERVERS and LAST SEEN. Use Load more for additional retained entries.
The drawer shows historical attack records. A count does not establish that an address is blocked now, or distinguish every authentication failure from connection-related activity. Check current IPDB policy before changing access; use traffic diagnosis before treating request volume as an attack.
Review IPDB attack history
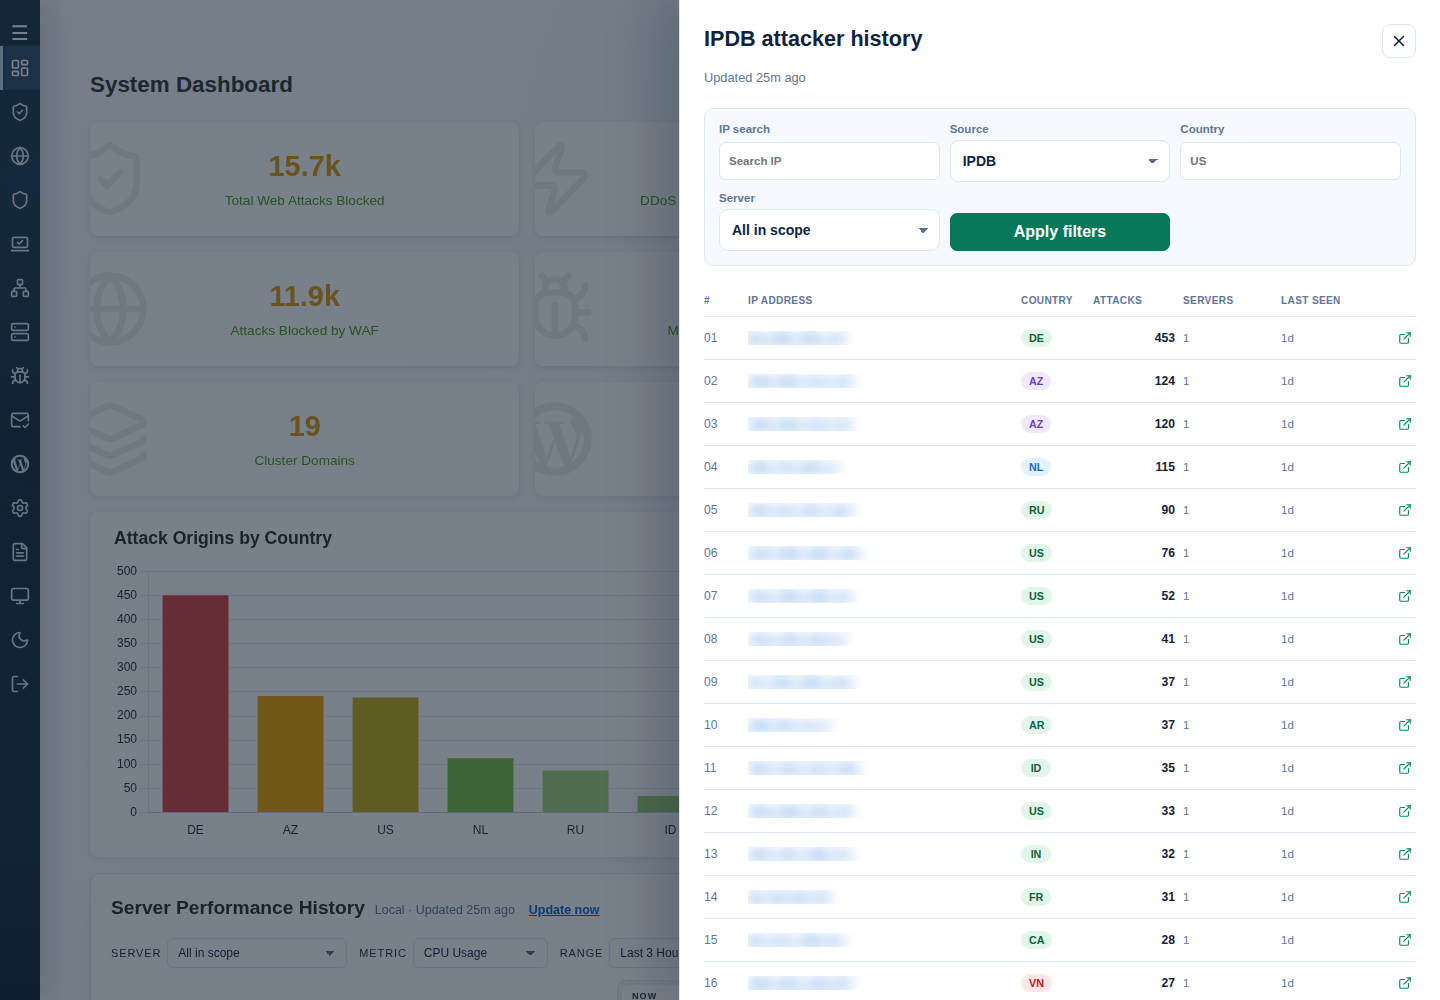
Section titled “Review IPDB attack history”- Choose the dashboard’s server scope, then select IPDB Protection Attacks Blocked.
- In IPDB attacker history, check Source is IPDB. Use IP search, a country code in Country, and Server, then Apply filters.
- Read the recorded counts and LAST SEEN, and use Load more when offered.
All in scope includes only the dashboard’s chosen servers; the drawer’s server filter does not add another server to that selection. SERVERS counts affected servers. Updated describes collection freshness, while LAST SEEN belongs to the retained entry. An AbuseIPDB link is an external reputation reference, not cPFence’s current allow/block decision. For exceptions or expired blocks, inspect the address on the IPDB page.
Review killed-query history
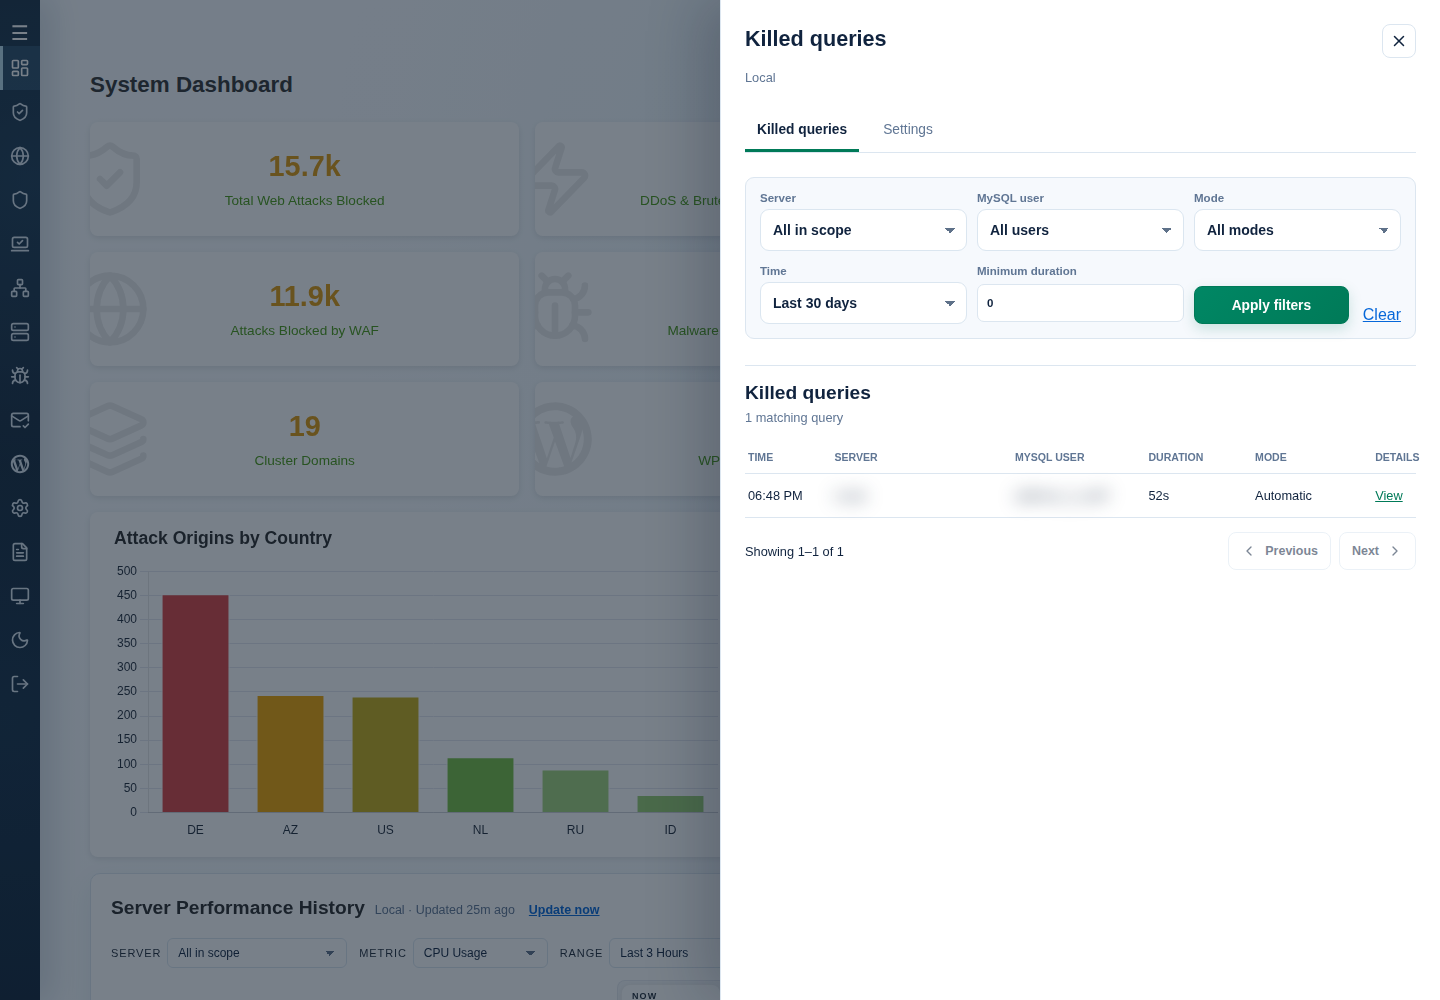
Section titled “Review killed-query history”- Choose the dashboard’s server scope, then select Slow Queries Killed to open Killed queries.
- Filter by Server, MySQL user, Mode (Automatic or Manual) and Time. Time choices include Last 30 days, Last 7 days, Last 24 hours, All retained and Date range; a date range uses From and Through.
- Set Minimum duration in seconds if needed, then Apply filters. Use Clear to reset filters and Previous/Next to page through matching records.
- Read Time, Server, MySQL user, Duration and Mode, then choose View for the intended record.
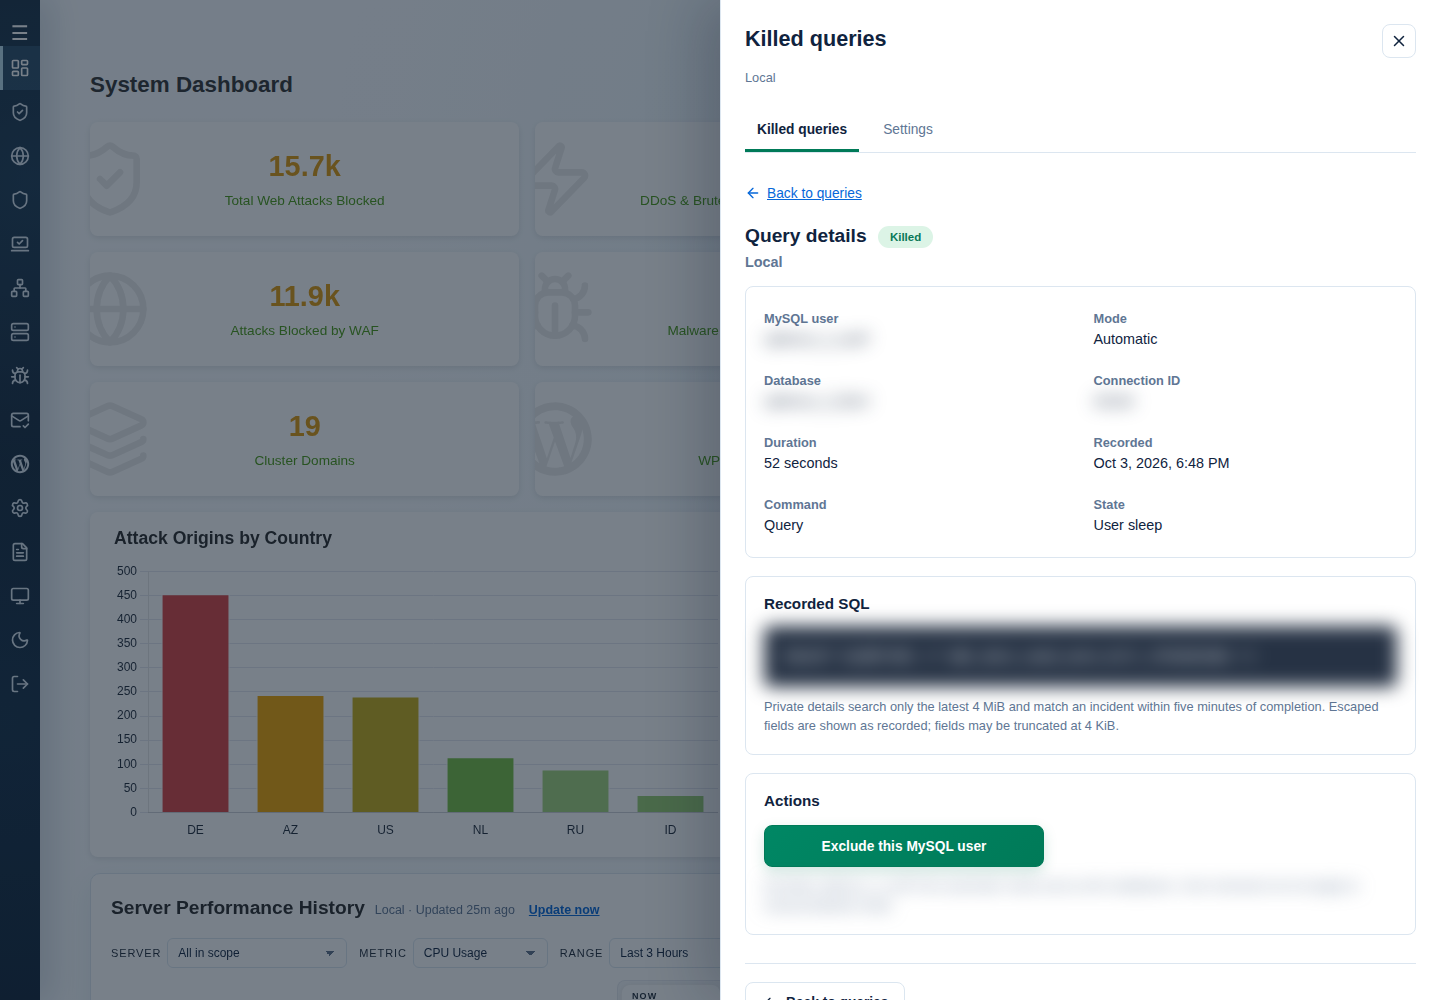
In Query details, read the recorded outcome, user, mode, database, connection ID, duration, time, command and state. Recorded SQL is private historical text and may be truncated or unavailable for older records. Missing details do not prove that no query was killed. Use Back to queries to return.
Private details require Dashboard and Advanced Settings permissions. Keep query text and customer identifiers private.
Adjust AutoMySQL settings
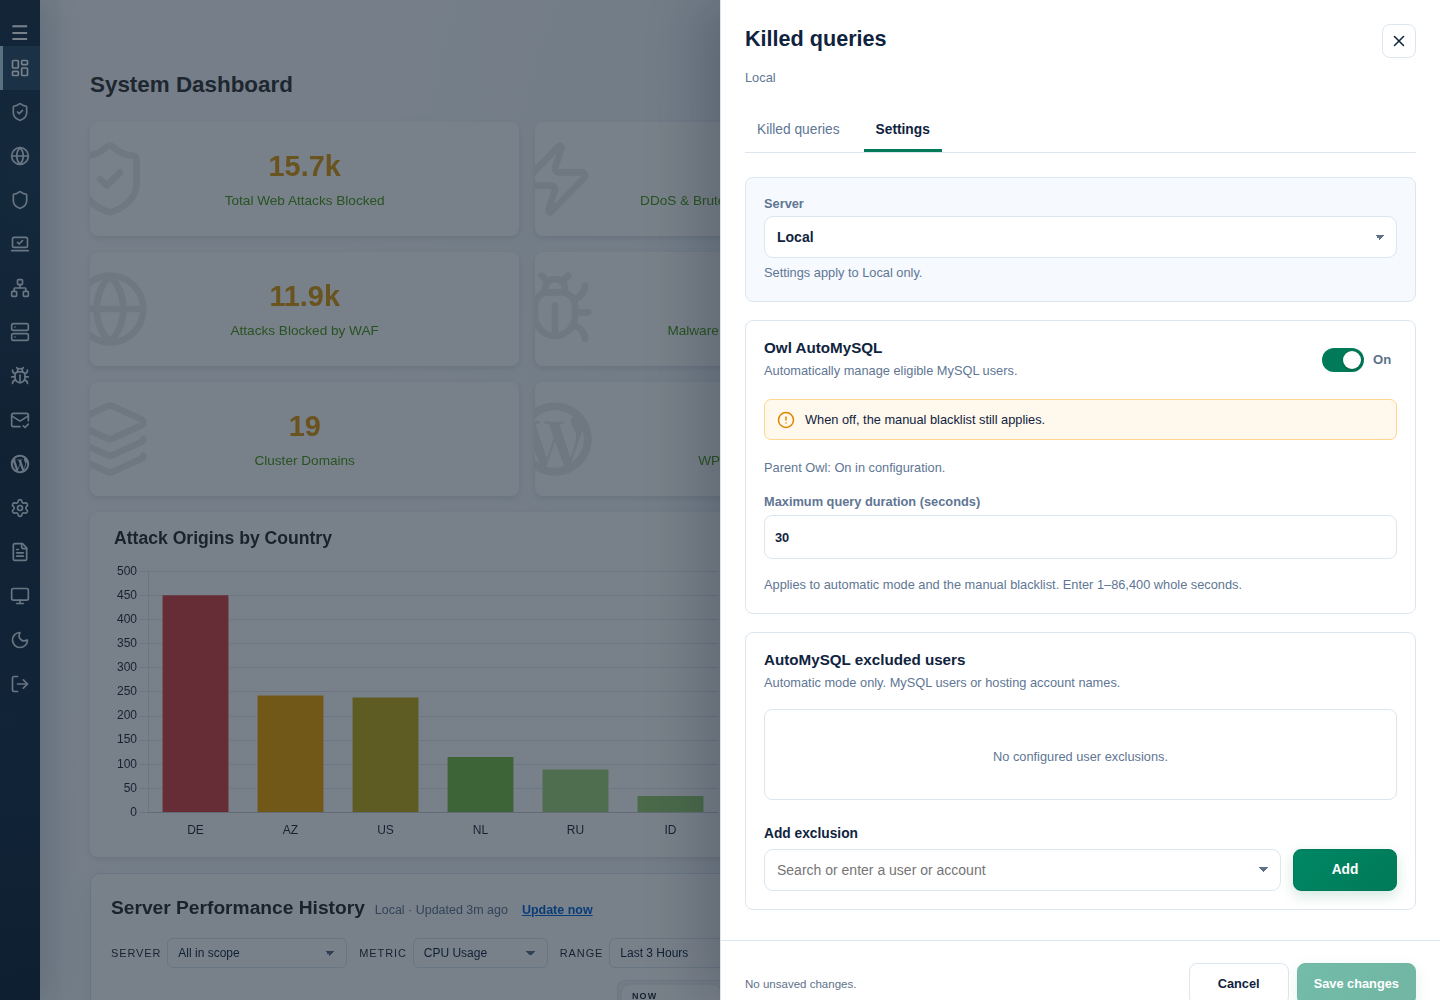
Section titled “Adjust AutoMySQL settings”- Open Settings and choose one server. Read Settings apply to … only and the parent Owl context before changing anything. Owl monitoring must be enabled to edit the duration.
- Set Maximum query duration (seconds) to a whole number from 1–86,400; it applies to automatic mode and the manual blacklist. Set Owl AutoMySQL or use Add exclusion, Search or enter a user or account, then Add as needed. These edits remain staged until Save changes.
- Review the exact entries, Save changes, and check the result. On an error, reload settings and verify the target’s state before retrying. Cancel leaves the settings view; discard unsaved edits if prompted.
Exclude this MySQL user in Query details also stages an exact-user exclusion for review in Settings. It affects automatic mode across that user’s databases, not manual blacklist mode. A hosting-account entry covers all its associated MySQL users. To reverse an exact-user exclusion, remove the entry and save; a hosting-account exclusion can still cover that user. Turning automatic mode off leaves the manual blacklist in effect. Follow AutoMySQL policy and recovery for manual users, duration and parent Owl controls. Viewing settings and managing General Settings require separate grants.
3. Use diagnostics and live views
Section titled “3. Use diagnostics and live views”Open Advanced Tools for Owl™ Statistics Summary, Protection Statistics, Show cPFence Status, and Summary of Server Health & Status. Select the server scope before starting a command and read the output’s server labels.
Live tools show WAF logs, IPDB attacks, Owl output, AutoMySQL killed queries, and web-server logs. Use the viewer’s stop control when finished; this stops your view while preserving protection and other users’ views.
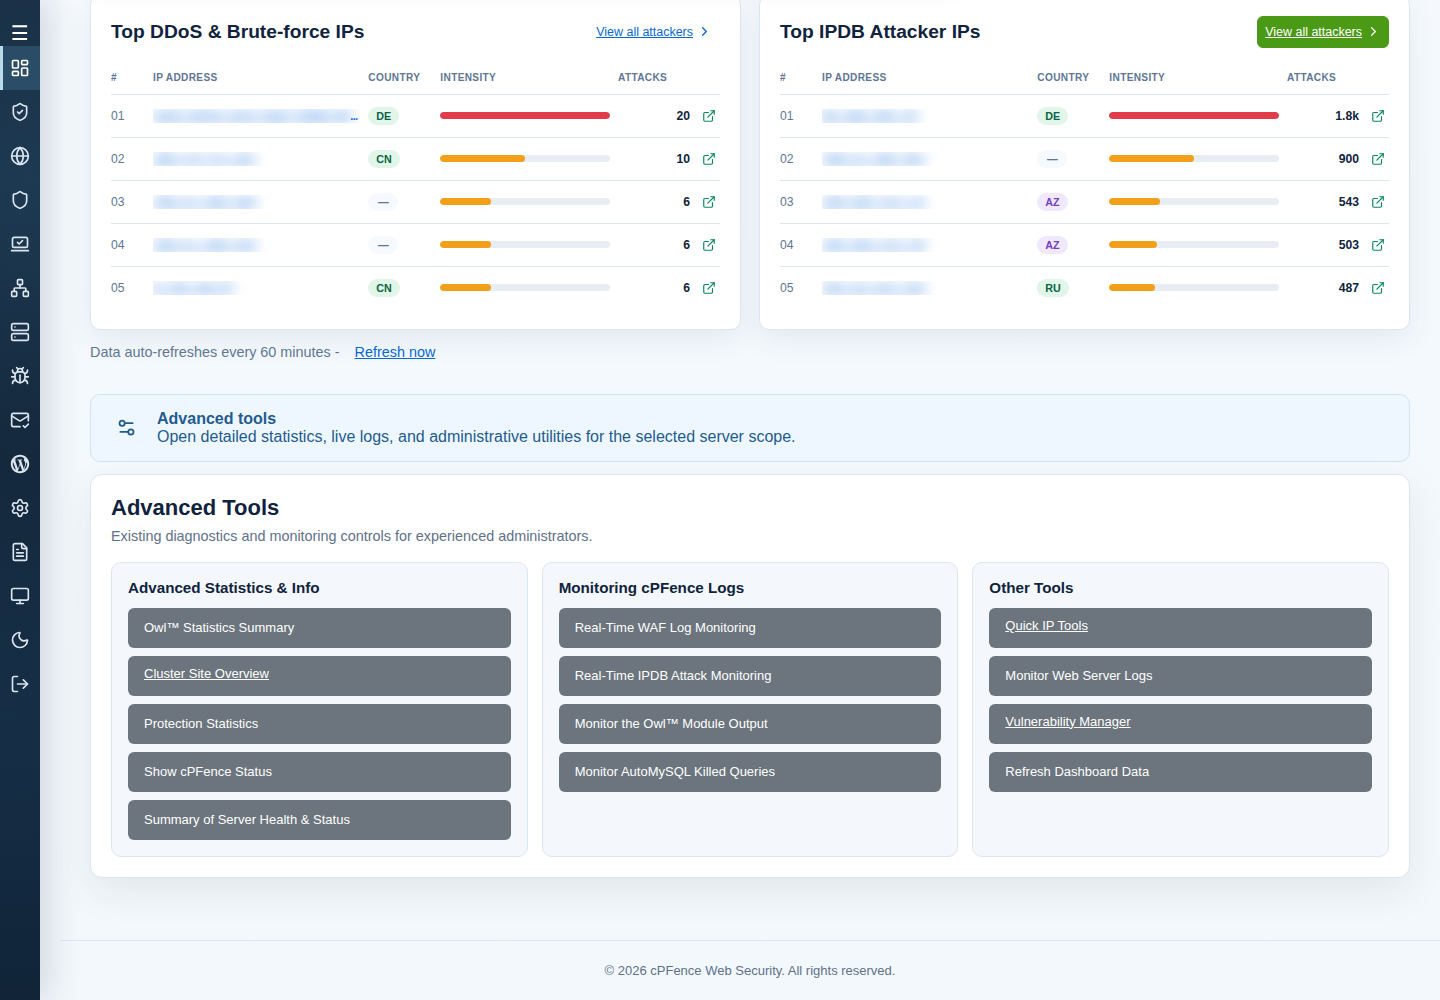
Refresh Dashboard Data requests a data refresh; it is not a malware scan. Use the scan workflow to launch a scan.
4. Confirm action targets and completion
Section titled “4. Confirm action targets and completion”- Open an action from its owning page and inspect the named servers or sites in its preview. Review exclusions and unavailable members too.
- Cancel if the targets differ from your intent. Change scope or selection and open a fresh preview.
- Confirm once, then keep the progress or output view open. A submitted, queued, or running request has not completed.
- Read each target’s result. Completion for one server does not establish completion for another; partial failure requires checking the failed targets individually.
Where Copy output is offered, use it to keep the displayed command output, then remove private server, site and account details before sharing it. The request finished means that request’s output stream ended; an operation that queued background work still needs its own final job result.
Troubleshooting
Section titled “Troubleshooting”- Unavailable or stale server: open Servers and review its connection. Retained data can help diagnosis but does not establish current protection.
- Missing page, rows, or action: ask an administrator to check the account’s server grants and permissions.
- No next history page: the available dataset may fit on one page. Disabled pagination is not proof that another page exists.
- Scope changes while a dialog is open: discard the old preview and confirm a fresh one. A search or filter is not a replacement for target selection.