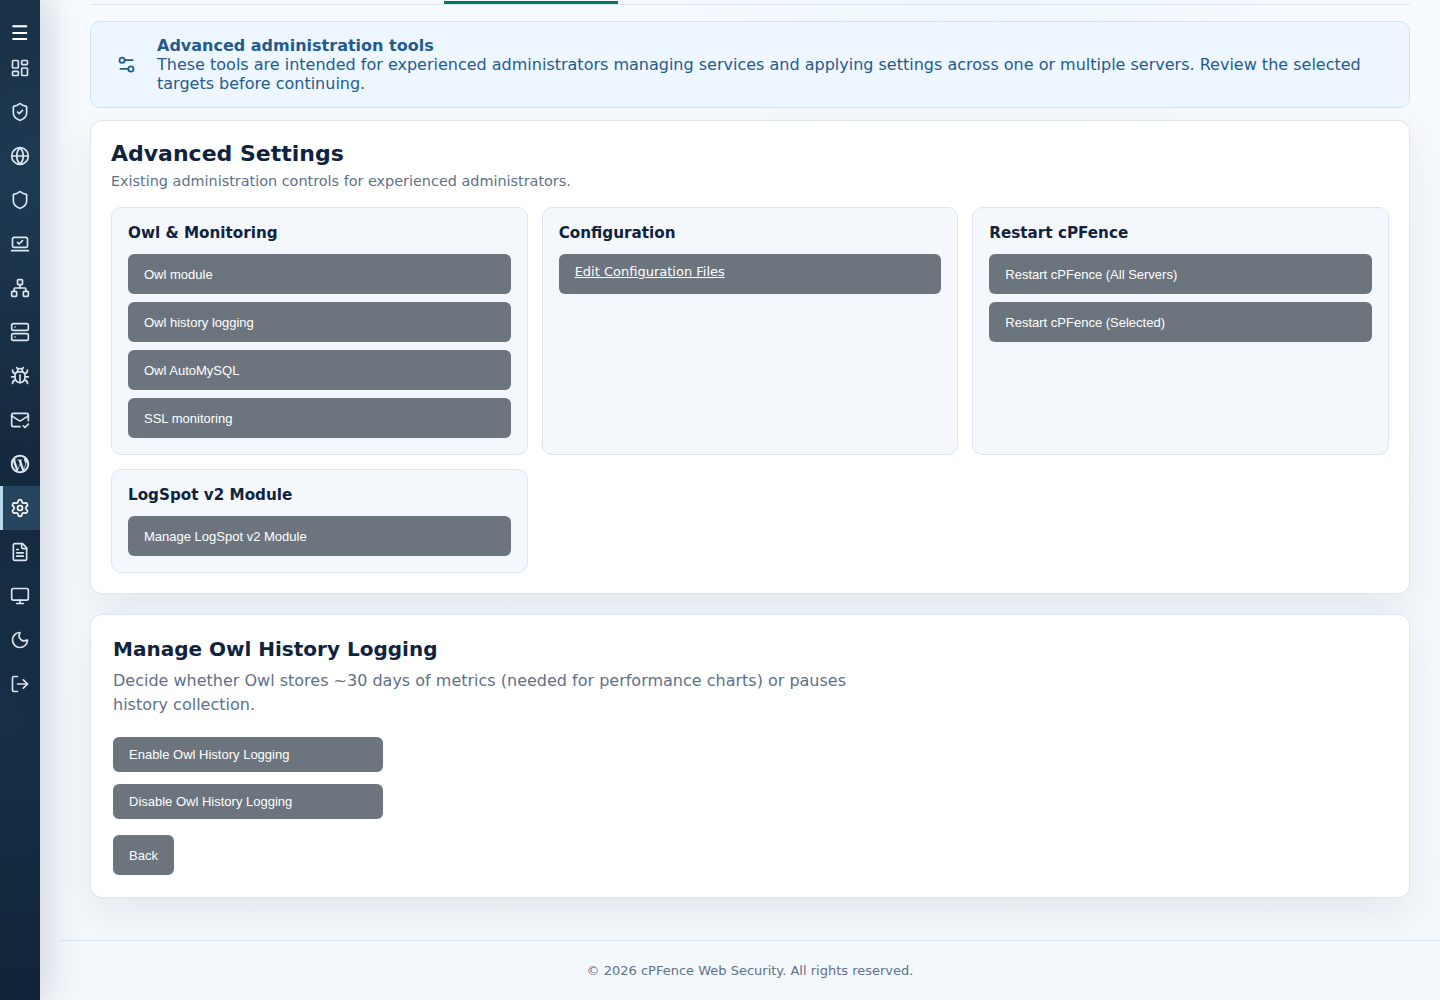
Restore missing Owl chart data
- Open System Dashboard and check the SERVER, METRIC, RANGE and observation time.
- Choose Update now for the chart or Refresh now for the Dashboard.
- On the intended server, check Owl monitoring and Owl history in System Settings.
- For missing secondary-server data, inspect its connection and follow secondary server connection troubleshooting.
- Check current status and module output before using the reviewed Owl restart control.
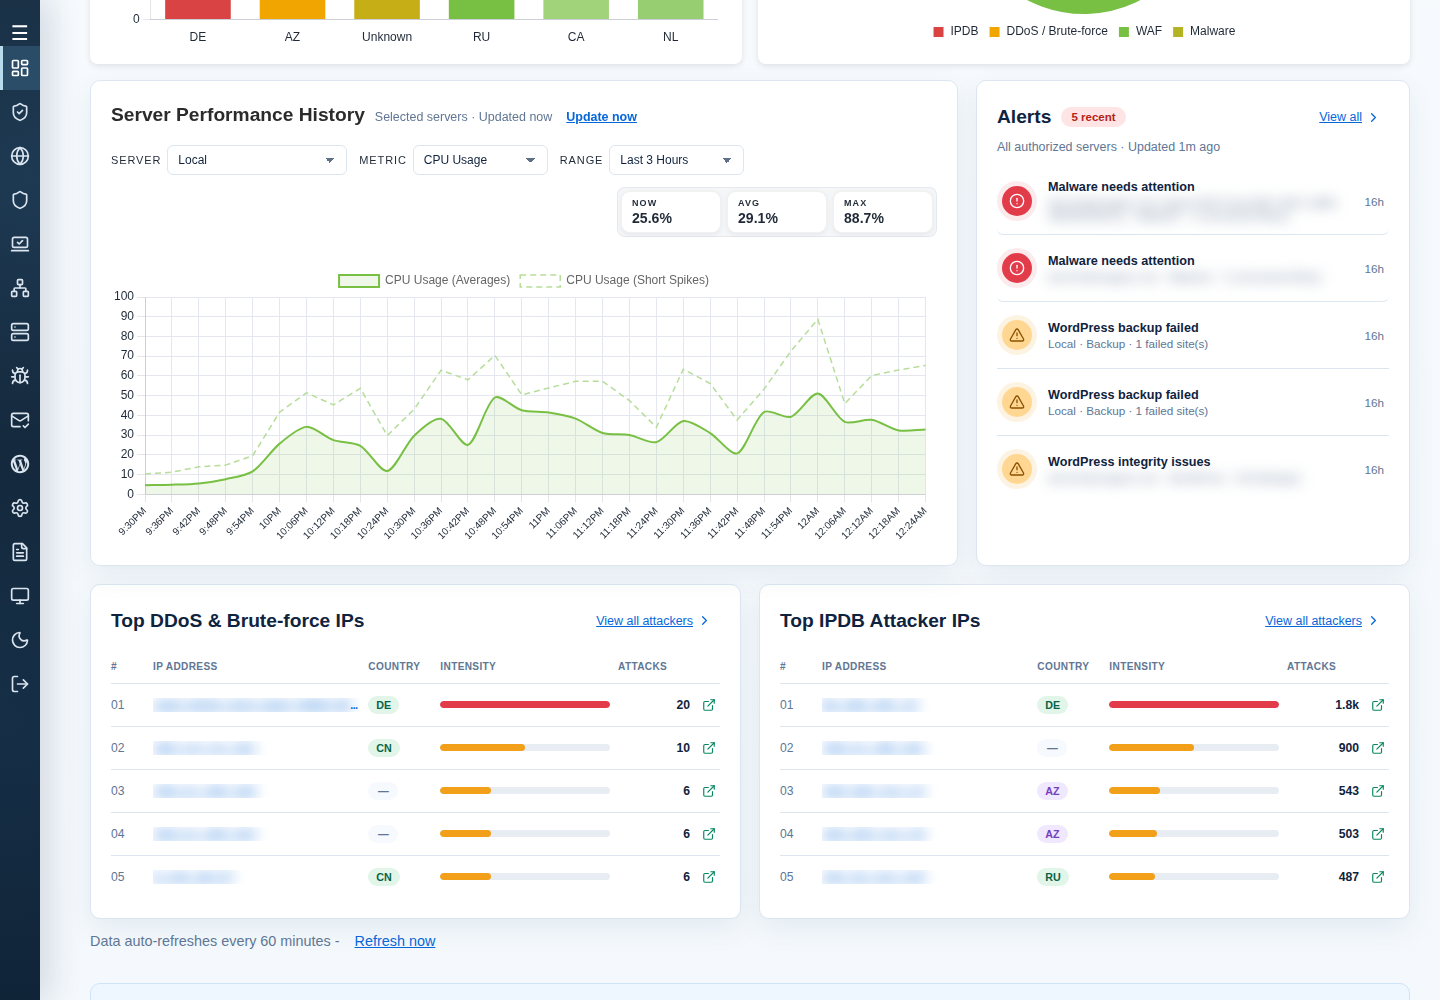
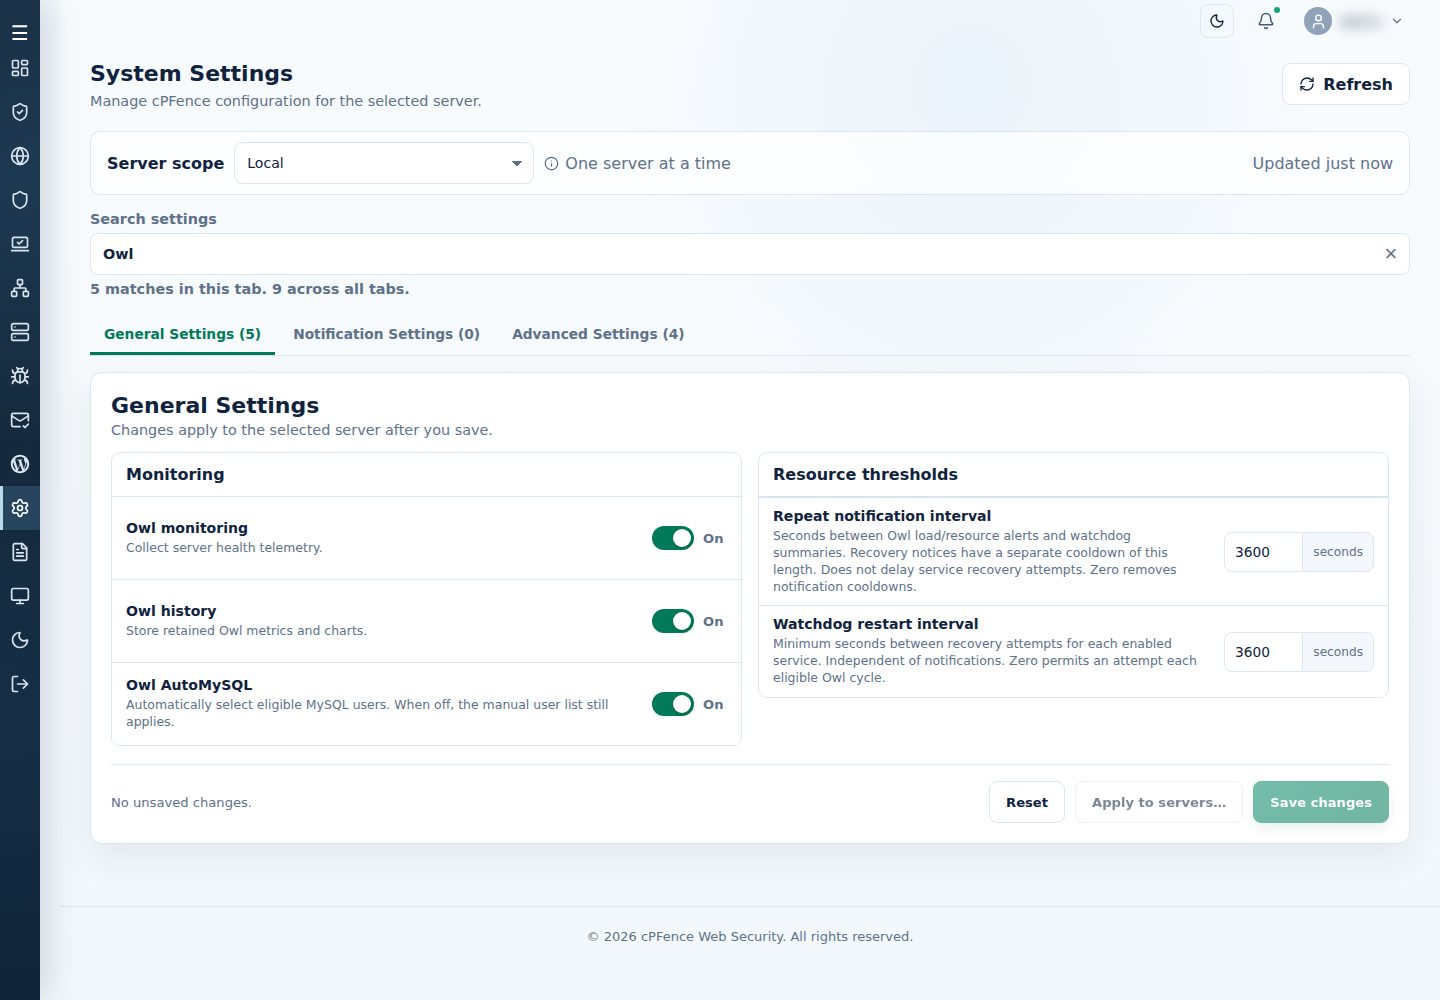
After correcting the connection or collection setting, refresh and allow a few minutes for new observations. If the WebUI itself still needs a restart, a root administrator can run cpfence --restart-webui on the main control panel server, then reopen the page.
Missing data is not zero usage. Turning history off stops new collection while retaining old history. Current telemetry uses the verified cPFence server connection; adding passwordless SSH is not a chart-connectivity repair.