
Use Owl and LogSpot
Owl supplies server health monitoring, retained charts and eligible MySQL query controls. LogSpot supplies per-site traffic logs and reports. These Enhance WebUI tools act on their selected servers and have different data-retention effects.
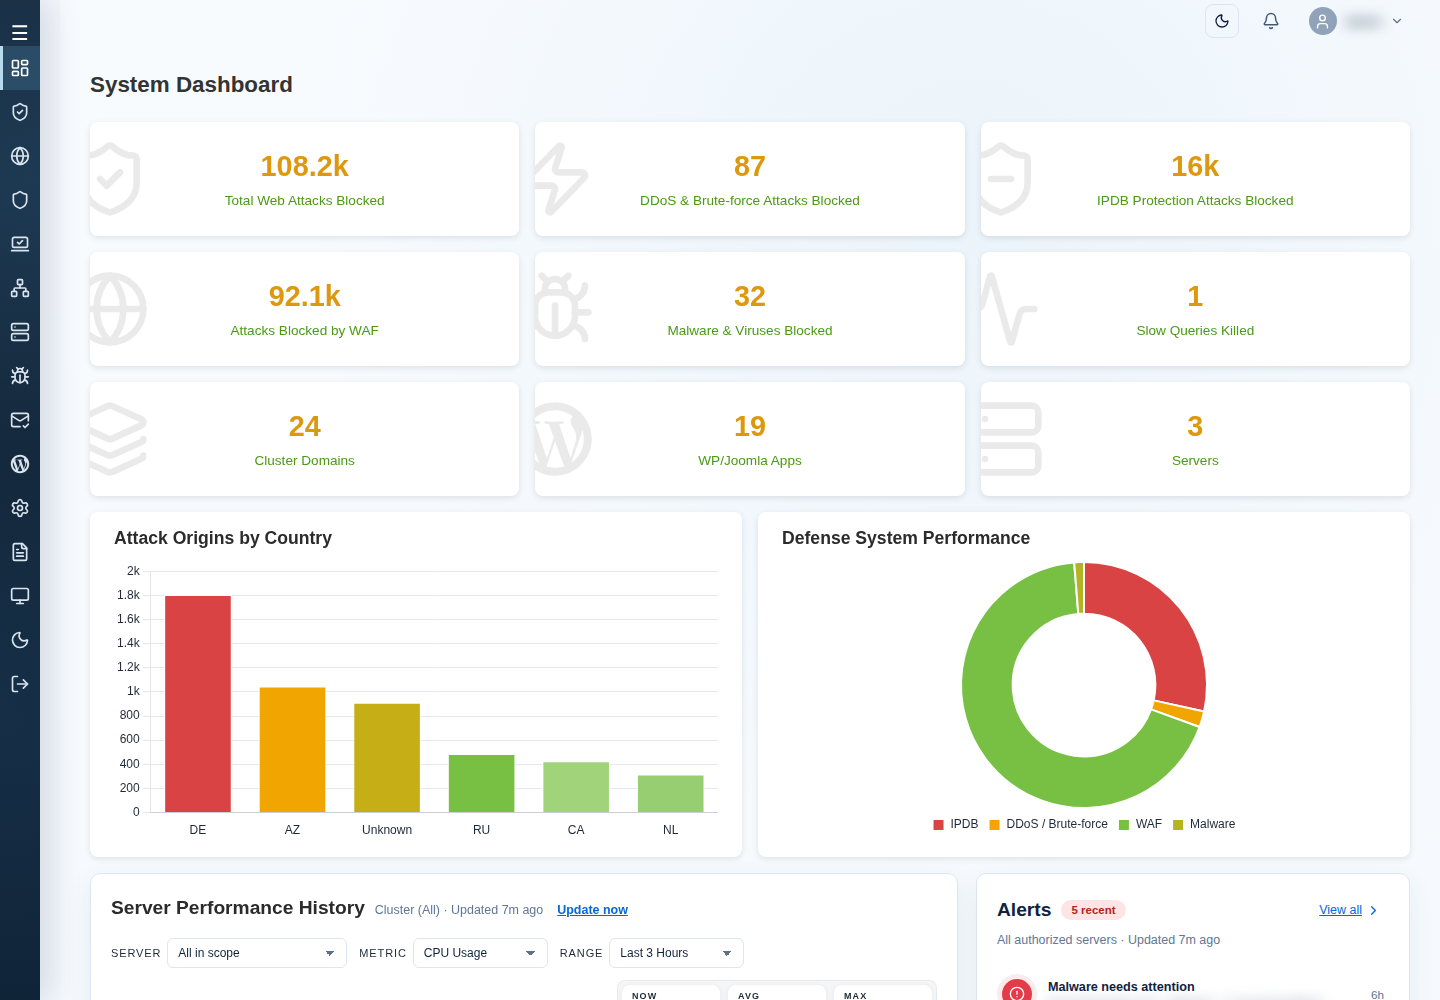
Support users need server access and the relevant Dashboard/log or settings permission. Choose the server targets before a tool action and check its confirmation. Chart filters choose displayed data; they do not select bulk targets.
1. Read Owl status and history
Section titled “1. Read Owl status and history”- Open System Dashboard.
- Choose SERVER, METRIC and RANGE for the chart.
- Use Update now for the chart view or Refresh now for the dashboard. Check the observation times after refreshing.
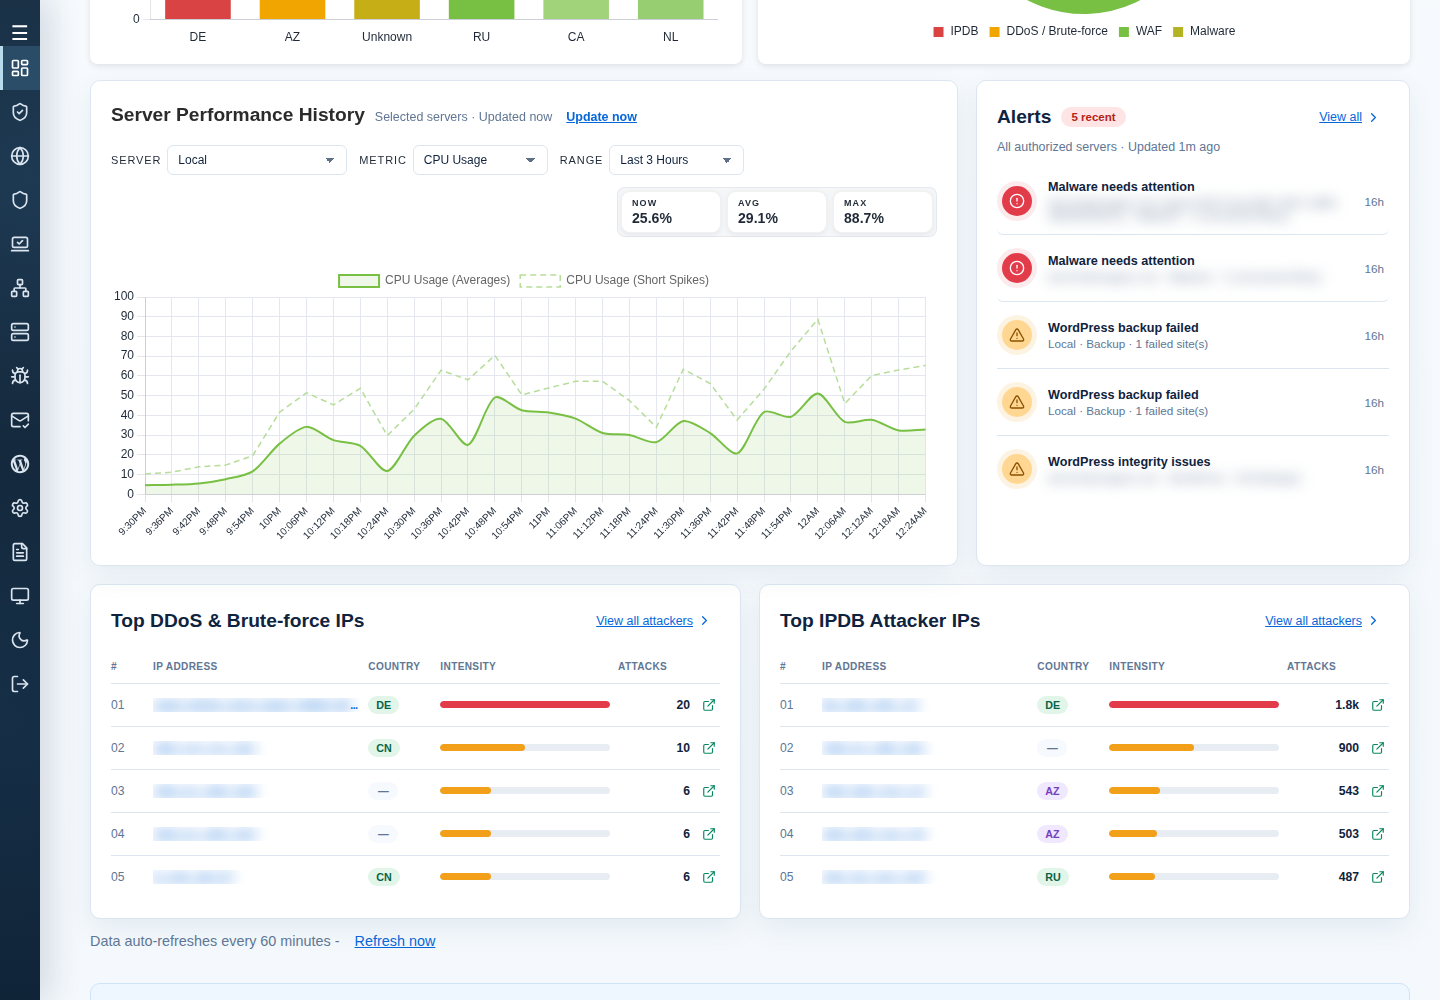
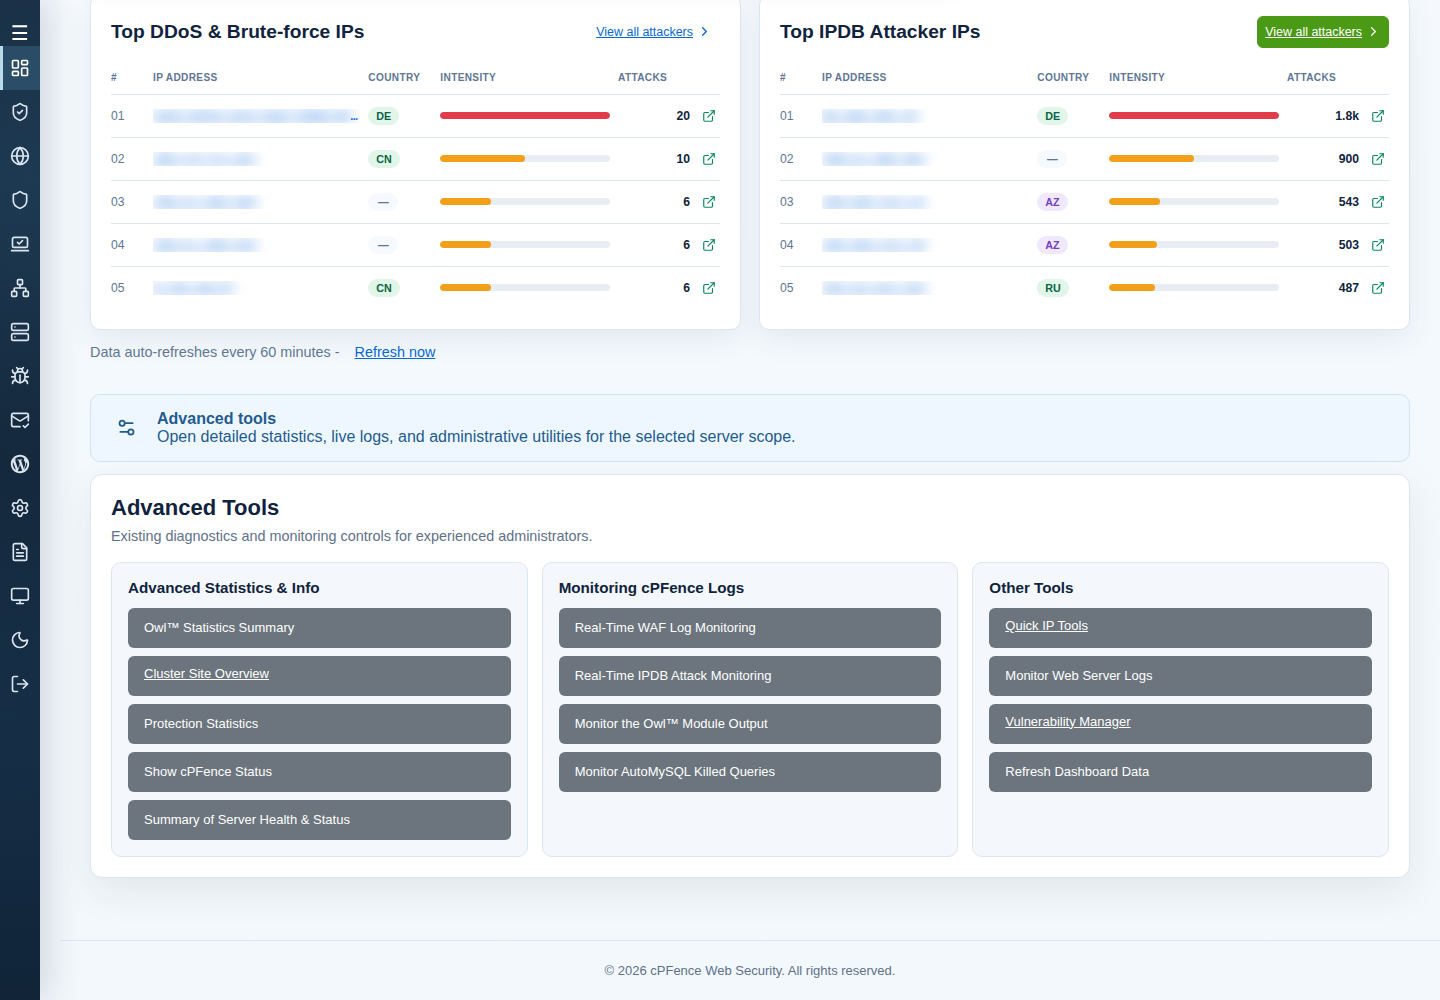
Advanced Tools offers Owl™ Statistics Summary, Protection Statistics, Show cPFence Status and Summary of Server Health & Status.
Check observation time and coverage. Missing data is not zero usage. Old history remains visible when new collection is off.
In System Settings → General Settings → Monitoring, review:
| Setting | Packaged default | Effect |
|---|---|---|
| Owl monitoring | On | Enable health monitoring and its eligible controls. |
| Owl history | On | Store new metrics. Off leaves existing retained history visible. |
| Owl AutoMySQL | On | Automatically select eligible hosting MySQL users for query control. |
| Blacklisted database users | Empty | Pipe-separated MySQL users or hosting accounts used in manual mode when automatic mode is off. |
| AutoMySQL excluded users | Empty | Pipe-separated exclusions used in automatic mode only. |
| Maximum query duration | 30 seconds | Eligible connections exceeding this threshold can be terminated; range 1–86400 seconds. |
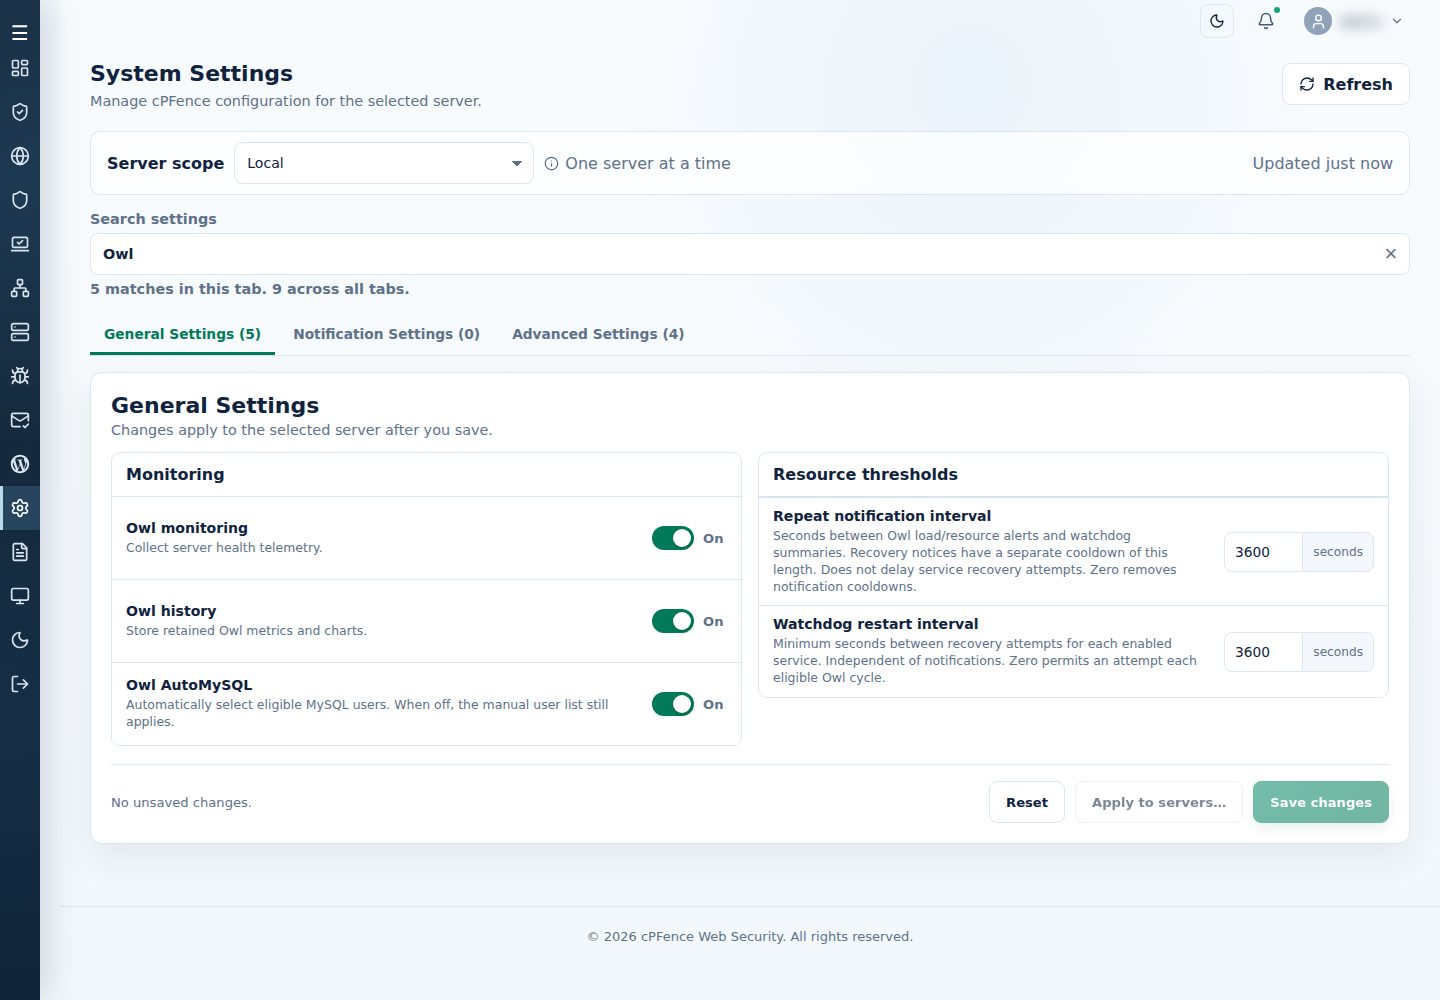
AutoMySQL off still allows manual mode. To stop both, turn automatic mode off and clear the manual list. Query termination can interrupt application work.
For the query-selection and exclusion steps, see Owl AutoMySQL. DDoS connection limits belong to IPDB protection settings; Connection limit defaults to 100 concurrent connections per source. Configure recipients and delivery in email and SMTP notifications.
2. Configure alerts and module controls
Section titled “2. Configure alerts and module controls”Configure load/resource alerts and delivery in Notification Settings. Set Resource thresholds in General Settings:
| Threshold/timing | Packaged default | Meaning |
|---|---|---|
| CPU load threshold | 3 | One-minute load value, not CPU percentage. |
| Memory, disk usage, disk I/O, inode thresholds | 80% each | Memory, root-filesystem usage/inodes and root-device busy time. |
| Alert delay | 300 seconds | Sustained threshold excess before alerting. |
| Repeat notification interval | 21600 seconds | Cooldown for applicable Owl load/resource and watchdog notices. |
| Watchdog restart interval | 3600 seconds | Minimum time between recovery attempts per enabled service; independent of notification cooldown. |
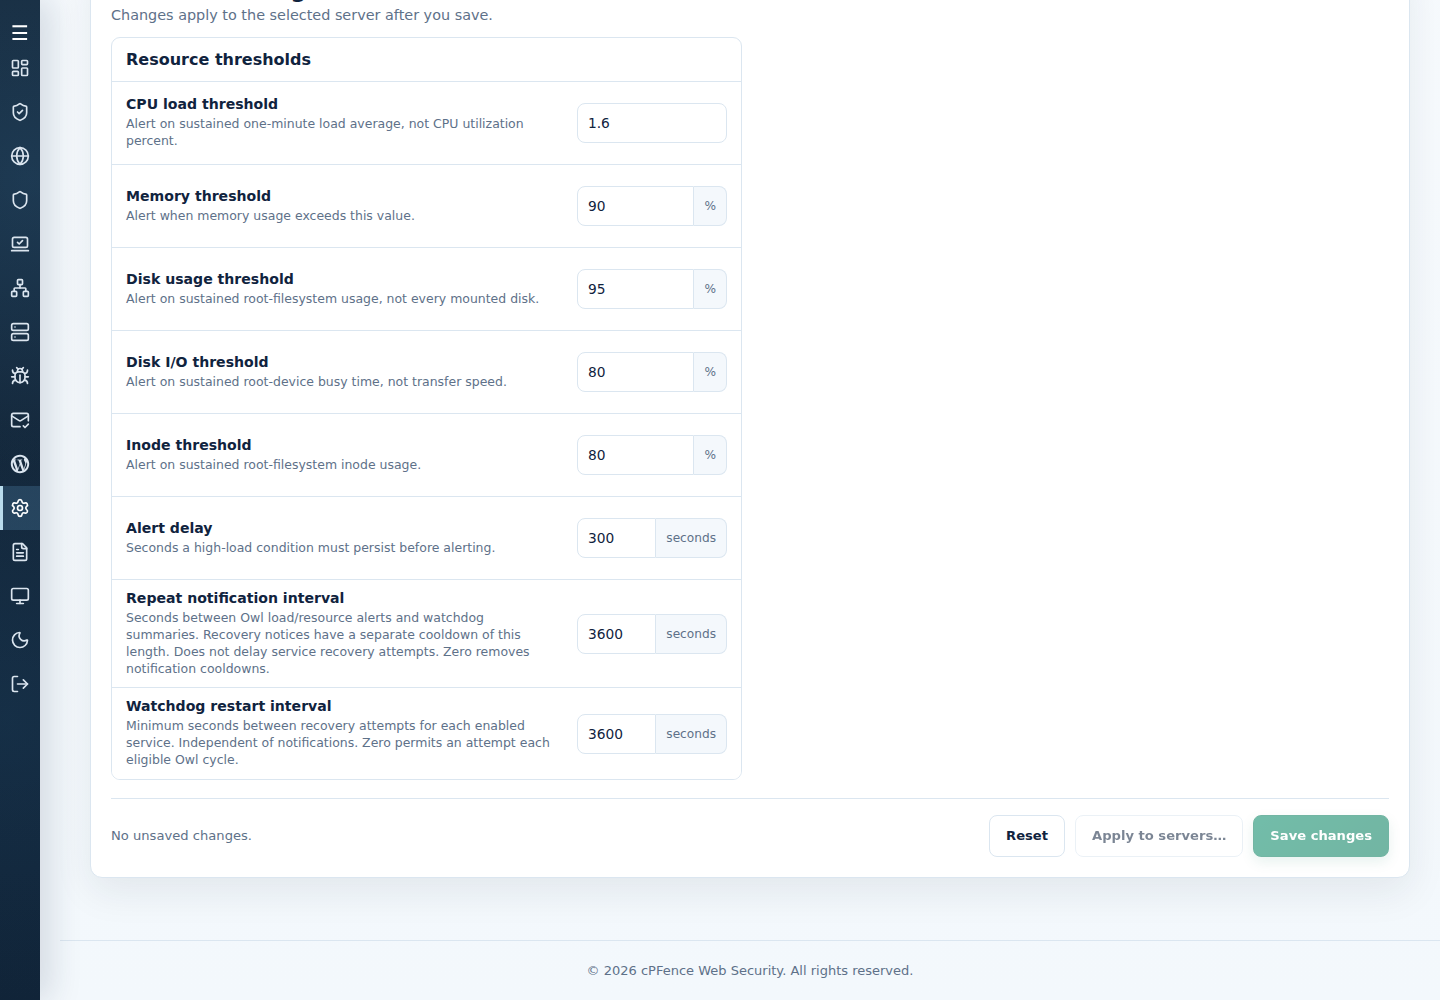
Notification cooldown does not delay watchdog recovery. Alert thresholds are separate from scan safeguards.
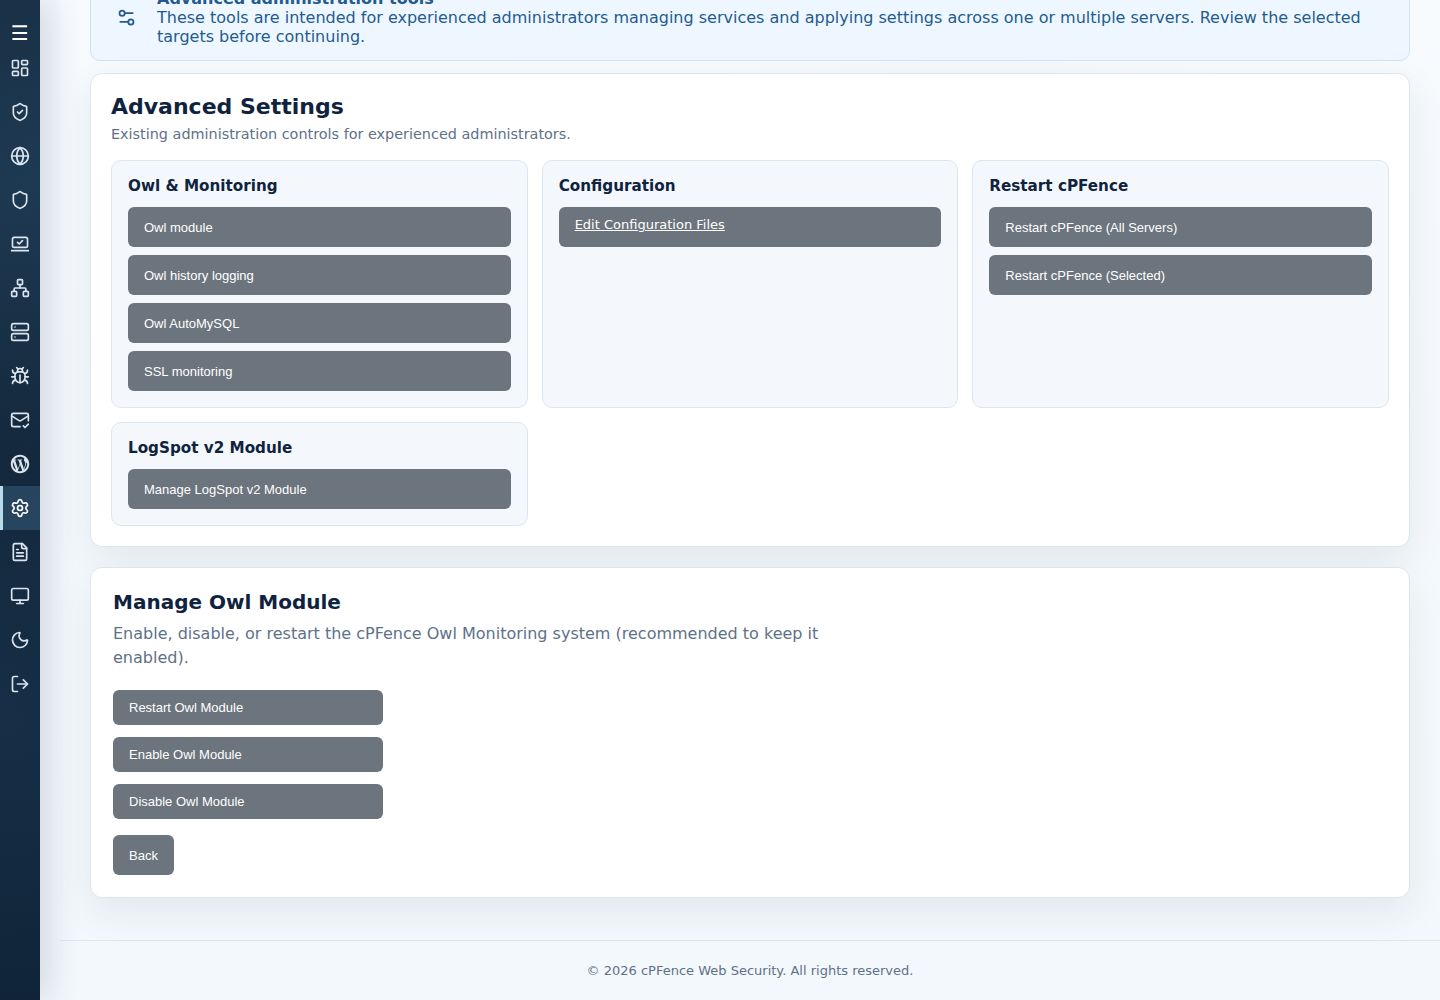
Under Advanced Settings → Owl & Monitoring, open Owl module, Owl history logging or Owl AutoMySQL, choose its action and confirm the targets. Read each server’s final output.
Root administrators can also run these controls on the intended server:
| Action | Command |
|---|---|
| Enable Owl | cpfence --enable-owl |
| Disable Owl | cpfence --disable-owl |
| Restart Owl | cpfence --restart-owl |
| Show statistics | cpfence --owl-stats |
| Enable / disable new history collection | cpfence --enable-owl-history / cpfence --disable-owl-history |
Use cpfence --owl-stats 2h to review a specific window. Follow module output with cpfence --monitor-owl-logs and query activity with cpfence --monitor-killed-queries. Retained killed-query details are in /var/log/cpfenceav/killed_queries.history; keep account and query details private when sharing them.
See resource alerts and watchdog troubleshooting for repeated notices, and missing chart data for collection or connection checks.
3. Follow current logs
Section titled “3. Follow current logs”On System Dashboard → Advanced Tools → Monitoring cPFence Logs, choose Monitor the Owl™ Module Output or Monitor AutoMySQL Killed Queries. Monitor Web Server Logs follows the selected server’s website logs. Read the scope before opening a stream.
After log replacement/rotation, reopen the view if it stops showing new entries. Closing it leaves protection running. Remove site/account details before sharing logs.
4. Configure LogSpot
Section titled “4. Configure LogSpot”Open System Settings → Advanced Settings → LogSpot v2 Module → Manage LogSpot v2 Module. Select and review the execution servers before using a control.
| Control | Effect |
|---|---|
| Enable LogSpot Module | Enable collection and managed viewers; its confirmation includes generated per-user passwords. |
| Disable LogSpot Module | Stop collecting traffic logs. |
| Restart LogSpot Module | Restart the enabled collector; it does not delete reports. |
| Max daily LogSpot file size (MB) / Save Log Size Limit | Set the per-file maintenance cap. Default 10 MB; zero truncates nonempty files and does not mean unlimited. |
| Enable LogSpot Auto Login / Disable LogSpot Auto Login | Permit/restrict report access using Website IDs. Treat those IDs as access-bearing information while enabled. |
| Remove LogSpot Data | Permanently remove generated LogSpot logs and reports on the confirmed servers. Preserve needed evidence before confirming. |
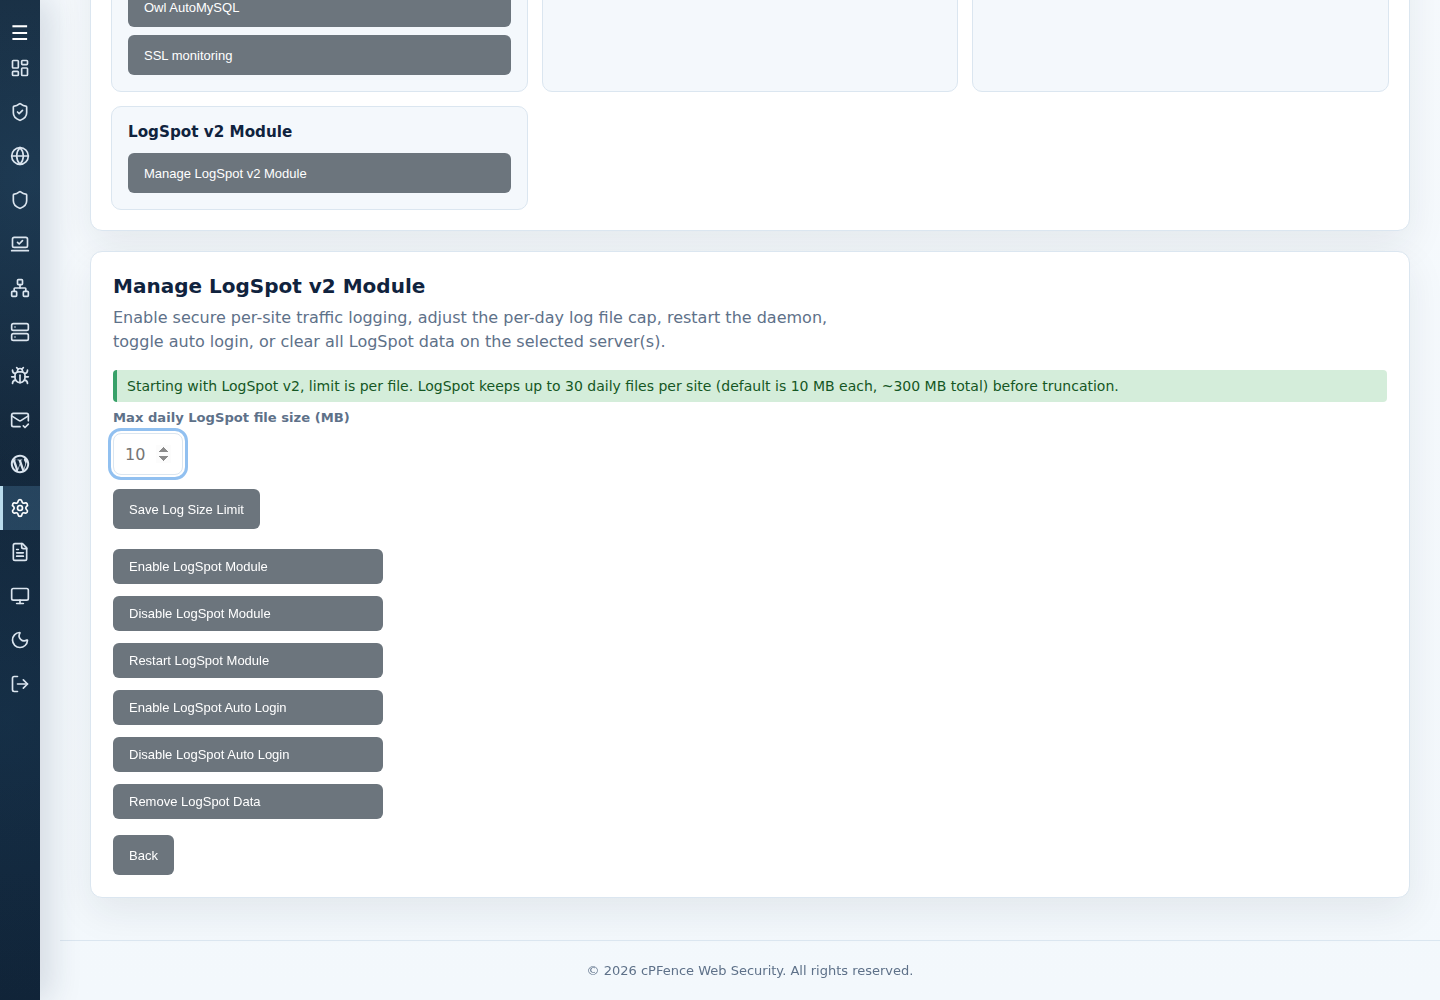
LogSpot and Website ID login default off. It retains up to 30 daily files per site; the cap applies per file. Clearing data leaves enabled collection able to create new data. Report access needs the intended integration and credentials.
The CLI alternatives act on the server where they run:
| Action | Command |
|---|---|
| Enable / disable collection | cpfence --enable-logspot / cpfence --disable-logspot |
| Restart collection | cpfence --restart-logspot |
| Set the daily file cap | cpfence --set-logspot-logsize 10 |
| Enable / disable Website ID login | cpfence --enable-logspot-autologin / cpfence --disable-logspot-autologin |
| Permanently remove generated reports and logs | cpfence --remove-logspot-data |
Open a site’s report at https://example.com/traffic-reports/ with its generated credentials. For customer access, follow the WHMCS integration steps. For a missing report, use LogSpot troubleshooting.
If a report or log is missing
Section titled “If a report or log is missing”Check scope, module status and last observation. For LogSpot, check collection, file cap, data clearing and viewer login. For charts, check Owl history separately.
Read each target’s result. If output ends unexpectedly, check current status before repeating an action. Preserve useful logs before clearing data.